
Technical outlook:
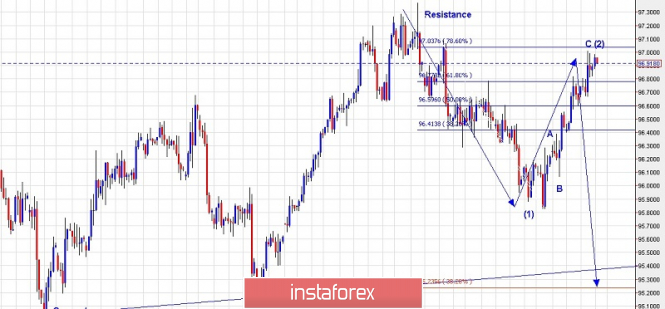
A 4H chart view has been presented here for the US Dollar Index to have a medium-term outlook into its wave structure. The US Dollar has managed to reach almost 97.00 levels as prices nearly complete its 3-wave corrective rally that began from 95.90 levels earlier. Also note that the US Dollar Index is stalling at a fibonacci 0.786 resistance levels of its previous drop between 97.36 through 95.90 levels respectively. A bearish reversal here would resume a multi-week drop that could potentially reach up to 94.00 levels and also further below. Overall wave structure is looking like an impulse drop (1) followed by a corrective 3-waves rally labelled as (2). The next move should be a 5-wave drop lower as wave (3) provided prices should stay below 97.30/40 levels. Immediate price resistance is at 97.36, while support is at 96.70 levels respectively.
Trading plan:
Remain short now, with risk above 97.40 levels, target is open.
Good luck!
The material has been provided by InstaForex Company - www.instaforex.com


 Download NOW!
No comments:
Post a Comment