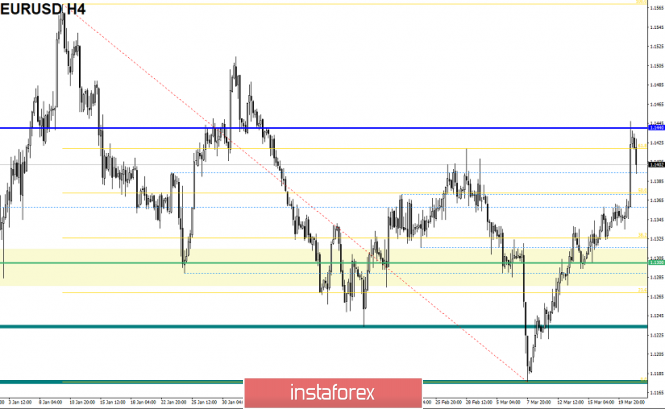
The currency pair Euro / Dollar for the last trading day showed an extremely high volatility of 112 points, in comparison with the previous days, having as a result of pulsed candles. From the point of view of technical analysis, we see that the sluggish market has been replaced by active growth, reaching as a result of the resistance level of 1.1440. Considering the chart in general terms, we see significant growth, in a little less than two weeks the quote jumped from 1.1180 to 1.1440, which is already alarming traders. Information and news background had a whole layer of information. We will start with the most anticipated event of the week - the meeting of the Federal Commission on Open Market Operations. Dear and beloved Fed Chairman Jerome Powell said at a press conference that this year they will not raise the interest rate, but a one-time increase is planned for 2020. At the same time, the head of the Federal Reserve announced a reduction in the volume of asset repurchases from May, and already in September of this year, he wants to stop the repurchase of assets. Naturally, against the background of the above, the dollar was literally spilled on all currency pairs, I think you have already appreciated the jump on the euro / dollar. Go ahead and turn to our beloved Brexit, as here the circus is in full swing.

Today, the circus tent continues, as Teresa May is in Brussels and there is an active process of discussing the postponement.
Further development
Analyzing the current trading chart, we see that a rebound from the level of 1.1440 has already occurred, which is quite normal against the background of this kind of overheating. It is likely to assume that the downward interest will still remain in the market, where, together with the information background, we can sink to 1.1380-1.1360.

Based on the data available, it is possible to decompose a number of variations, let's consider them:
- Positions to buy at this time are not considered due to a strong bearish interest. Consideration of these transactions will be carried out as soon as a point of support is found.
- Traders considered selling positions as soon as the price reached the level of 1.1440 and the deceleration process started. Now, there is a process of conducting the transaction in the direction of 1.1380-1.1360.
Indicator Analysis
Analyzing a different sector of timeframes (TF ), we see that in the short term, the indicators have changed to descending against the background of recovery of quotes. Intraday and mid-term prospects still maintain an upward interest.
Weekly volatility / Measurement of volatility: Month; Quarter; Year
Measurement of volatility reflects the average daily fluctuation , with the calculation for the Month / Quarter / Year.
(March 21, was based on the time of publication of the article)
The current time volatility is 44 points. It is likely to assume that due to the information background, volatility can still grow.
Key levels
Zones of resistance: 1.1440; 1.1550; 1.1650 *; 1.1720 **; 1.1850 **; 1.2100
Support areas: 1.1300 **; 1.1214; 1.1120; 1.1000
* Periodic level
** Range Level
The material has been provided by InstaForex Company - www.instaforex.com


 Download NOW!
No comments:
Post a Comment