
Technical market overview:
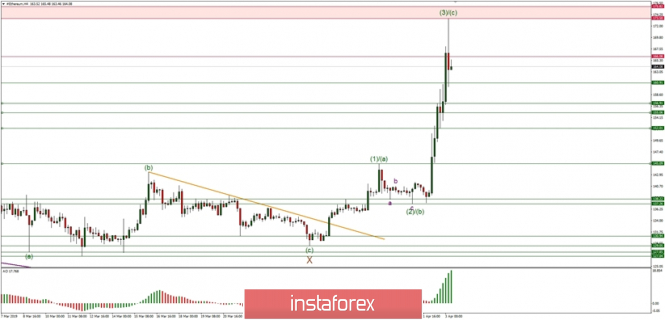
The ETH/USD pair has hit the lower boundary of the technical resistance zone located between the levels of 173.50 - 175.82 and a Ping Bar like candle appeared on the chart. The top at the level of 173.50 has been labeled as the wave (3)/(c) and now the market is consolidating the gains in a form of a correcting in a possible wave (4). The key technical support is seen at the level of 160.91 and any violation of this level would be the first clue the top is in.
Weekly Pivot Points:
WR3 - $163.07
WR2 - $154.26
WR1 - $146.96
Weekly Pivot - $137.84
WS1 - $131.51
WS2 - $121.49
WS3 - $115.39
Trading recommendations:
The target at the level of 174.50 has been hit, so all buy orders should be closed now and there should not be short-term buy orders opened. It is a good time to take the profits out of the table and wait for another trading setup.


 Download NOW!
No comments:
Post a Comment