
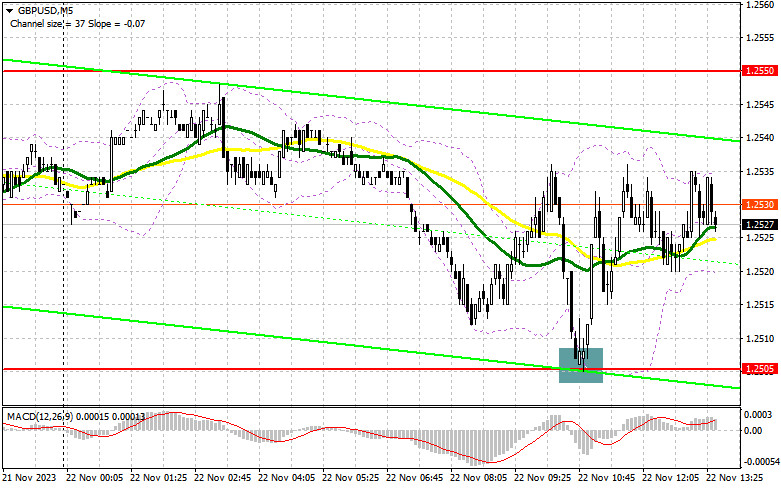
In my morning forecast, I drew attention to the level of 1.2505 and recommended making decisions based on it for market entry. Let's look at the 5-minute chart and analyze what happened there. The decline and the formation of a false breakout led to a buy signal, resulting in an upward movement of more than 30 points. Since trading remained within the channel, the technical picture needed to be reconsidered for the second half of the day.
To open long positions on GBP/USD, it is required:
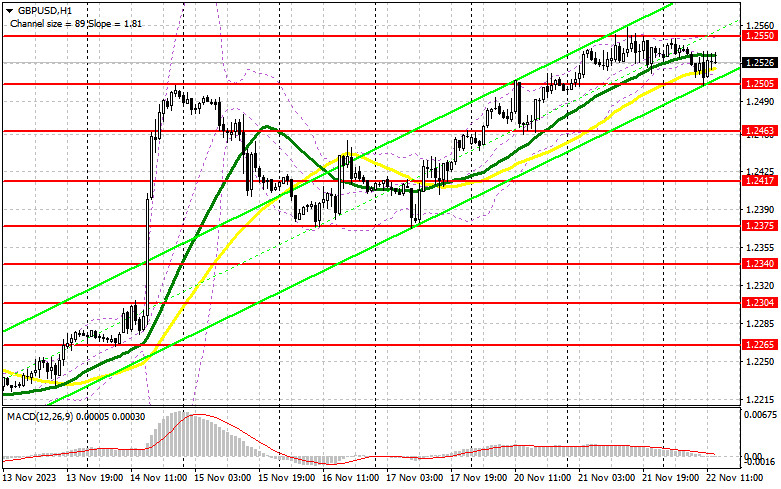
Weak data on the number of initial jobless claims, the University of Michigan Consumer Sentiment Index, and a decrease in inflation expectations will likely further weaken the dollar's position in the second half of the day. If the reaction to the reports is bearish, you can act similarly after forming a false breakout around 1.2505. This will lead to an upward trend to update this month's maximum of 1.2550. Breaking and consolidating above this range will lead to a new signal to open long positions with a target of 1.2589. The ultimate target will be the area of 1.2626, where I will take profit. In the scenario of a pair's decline and the absence of activity from buyers at 1.2505 in the second half of the day, and this level has already worked well today, pressure on the pair will definitely increase. In this case, only a false breakout around the next support at 1.2463 will give a signal to open long positions. I plan to buy GBP/USD only on the rebound from 1.2417 to correct 30-35 points within the day.
To open short positions on GBP/USD, it is required:
Sellers attempted to continue yesterday's trend, but it didn't go well. In the second half of the day, I plan to sell GBP/USD only after the formation of a false breakout around the monthly maximum of 1.2550, which will give a chance for another downward movement towards the support at 1.2505, just above which the moving averages are located, playing on the side of buyers. Only breaking and a reverse test from the bottom to the top of this range will deliver a more serious blow to buyer positions, removing stop orders and opening the way to 1.2463. A more distant target will be the area of 1.2417, where I will take profit. In the scenario of GBP/USD growth and the absence of activity at 1.2550 in the second half of the day, it is quite likely that bulls will try to continue the upward trend after the unsuccessful attempt by sellers to break below the 1.25 figure, trading will move within the bounds of a new upward channel. In this case, I will postpone sales until a false breakout at 1.2589. If there is no downward movement there, I will sell GBP/USD immediately on the rebound from 1.2626, but only counting on a pair correction down by 30-35 points within the day.
Indicator signals:
Moving averages
Trading is carried out around the 30 and 50-day moving averages, indicating a sideways market.
Note: The author considers the period and prices of moving averages on the hourly chart H1, which differs from the general definition of classical daily moving averages on the daily chart D1.
Bollinger Bands
In case of a decrease, the lower boundary of the indicator, around 1.2505, will act as support.
Description of indicators
- Moving average (determines the current trend by smoothing volatility and noise). Period 50. Marked on the chart in yellow.
- Moving average (determines the current trend by smoothing volatility and noise). Period 30. Marked on the chart in green.
- MACD indicator (Moving Average Convergence/Divergence — convergence/divergence of moving averages). Fast EMA period 12. Slow EMA period 26. SMA period 9.
- Bollinger Bands. Period 20.
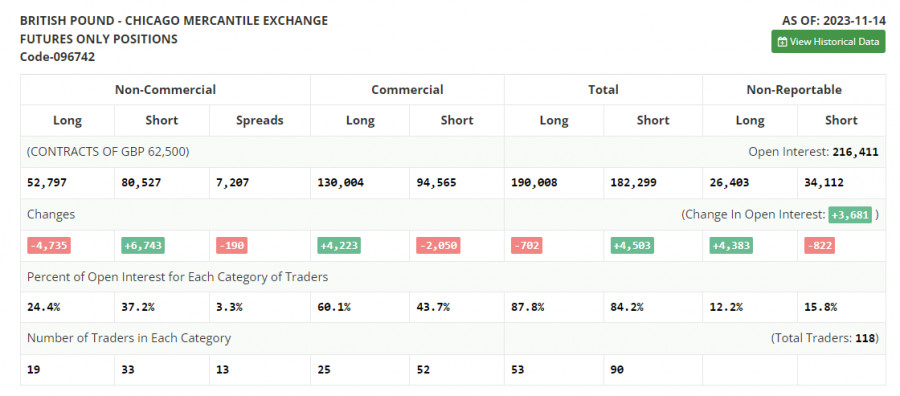
- Non-commercial traders - speculators such as individual traders, hedge funds, and large institutions using the futures market for speculative purposes and meeting certain requirements.
- Long non-commercial positions represent the total long open position of non-commercial traders.
- Short non-commercial positions represent the total short open positions of non-commercial traders.
- The total non-commercial net position is the difference between non-commercial traders' short and long positions.


 Download NOW!
No comments:
Post a Comment