
Has the bubble burst? After reaching a record high of nearly 74,000, Bitcoin plummeted like a stone. Fear over the prolonged maintenance of the federal funds rate at 5.5% has paralyzed the bulls on BTC/USD. One of the key drivers of the rally for the entire risky asset class may turn out to be an illusion, and the faster the cryptocurrency rose, the faster it will fall. Has the avalanche begun, and can it be stopped?
Unlike numerous forecasts of Bitcoin soaring to the moon when it set record highs in previous years, in 2017 and 2021, public interest is currently more subdued. Yes, BTC/USD quotes tripled over the last 12 months, but stories of others getting rich while you don't are not as common in the press. Google searches are great, but they're not as overwhelming as they were three and six years ago. Why? I suppose this time, the upward march of cryptocurrency is based on fundamental factors, not just Greed.
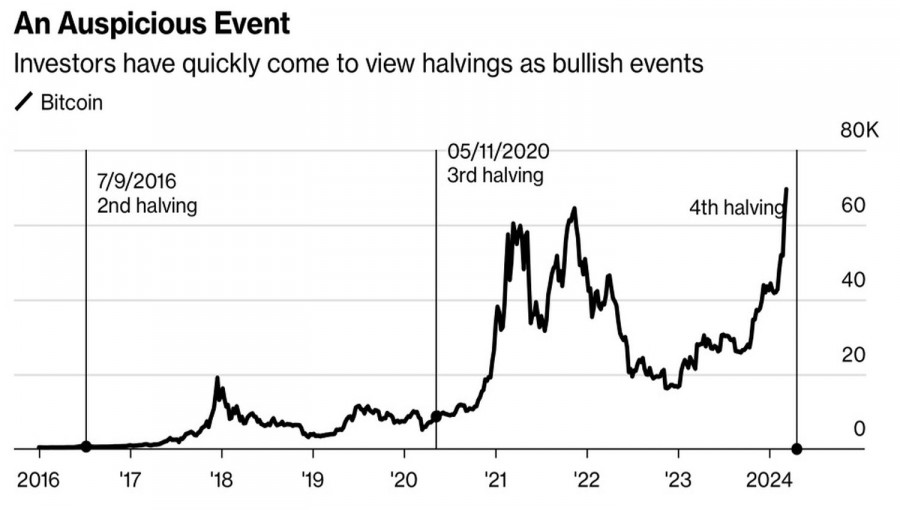
In economic theory, if the supply of an asset decreases and demand increases, the price should also rise. In this regard, the rise of BTC/USD is logical. In April, the halving, or halving of bitcoin emission, will occur, the fourth in history. Previous changes in the blockchain led to an increase in the cryptocurrency's quotes.
Bitcoin's Reaction to Halving
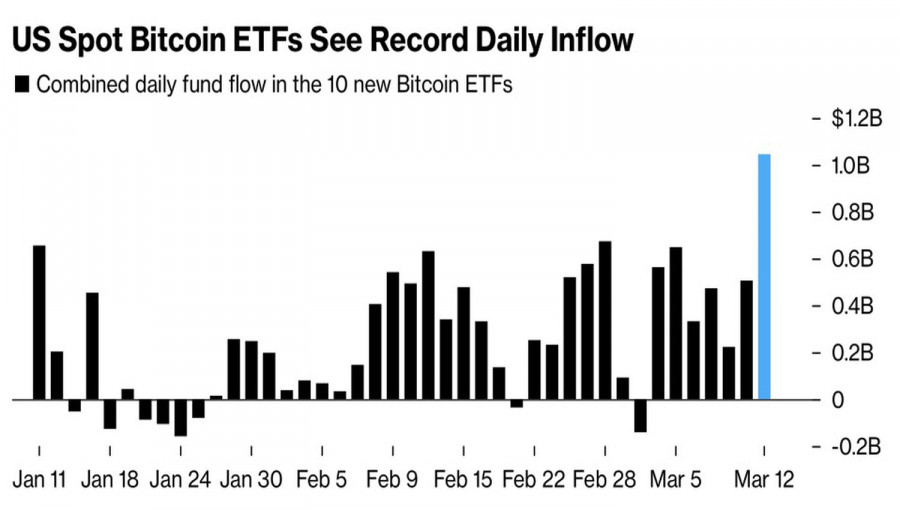
Bitcoin's demand situation is also quite good. Since its launch on January 11, ETFs oriented towards it have attracted $11.2 billion in net basis. Grossly, the figure exceeds $20 billion. Against the backdrop of record highs in BTC/USD, capital inflows on March 12 trading surpassed $1 billion for the first time in history, and the flagship specialized exchange-traded fund IBIT BlackRock set a new record of $849 million in a day.
However, skeptics are not giving up. In their opinion, there is a capital shift from more expensive to maintain ETFs to cheaper ones on the market. For example, the fee in the Grayscale Bitcoin Trust, which is facing an outflow of $10 billion, is 1.5%, while in IBIT BlackRock, it's only 0.25%.
Capital Inflows Dynamics into Bitcoin-Oriented ETFs
In addition to the interplay between supply and demand affecting prices, the external context holds significance. Until recently, it favored risky assets. Investors anticipated the Fed cutting the federal funds rate at least three times in 2024. However, doubts arose due to consumer price and producer price data, casting uncertainty on the Central Bank's actions. Forecasts suggesting two or even just one monetary expansion are becoming more prevalent in the market, particularly in November.
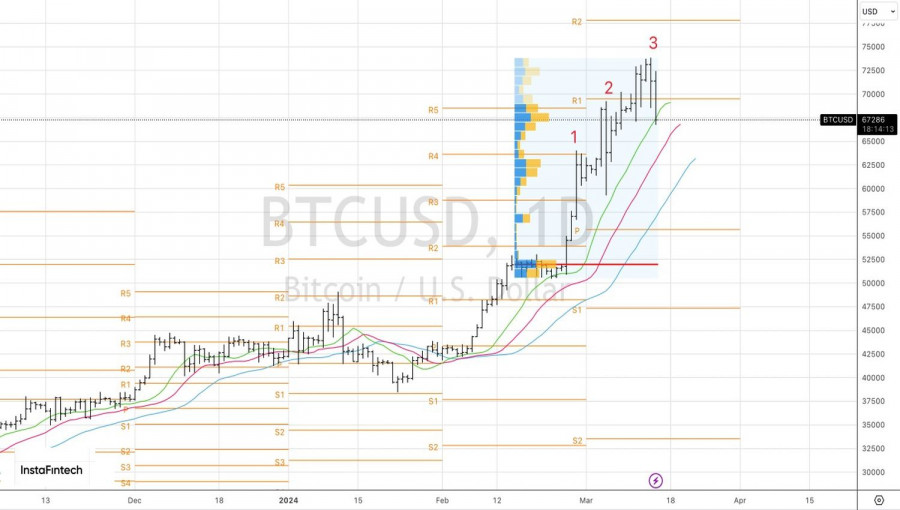
Technically, on the BTC/USD daily chart, there is a Three Indians reversal pattern and a test of dynamic support in the form of a green moving average. If the day closes below it, the correction to the upward trend will continue. Conversely, a rebound will allow the bulls to recover, and the cryptocurrency to consolidate. However, as long as Bitcoin is trading below the pivot level of 69,500, the focus should be on short-term sales.
The material has been provided by InstaForex Company - www.instaforex.com #


 Download NOW!
No comments:
Post a Comment