
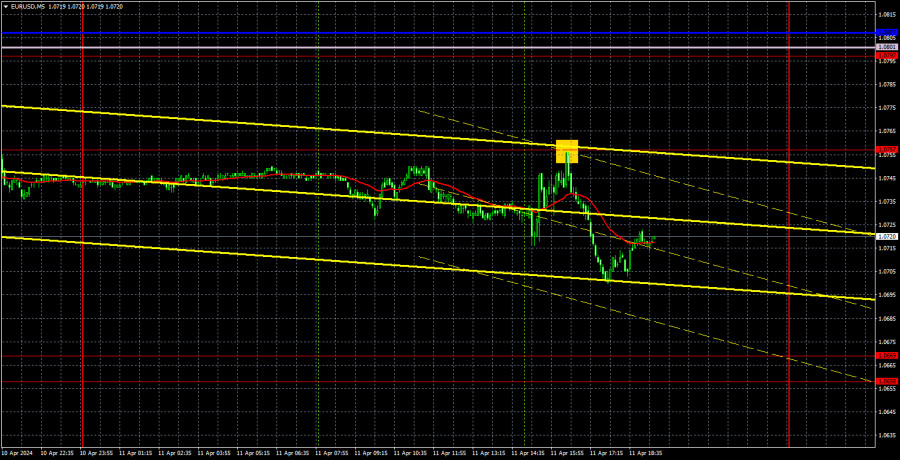
Analysis of EUR/USD 5M
EUR/USD returned to its familiar pattern of recent months. Despite dropping nearly 150 pips two days ago and the European Central Bank meeting yesterday, volatility was less than 60 pips on Thursday. On one hand, the ECB did not make any significant decisions, and ECB President Christine Lagarde was quite vague during the press conference. In particular, the market did not receive any specific details from her regarding possible monetary easing at the next meeting in June. Lagarde said that there will be a lot more data available at the next policy meeting (presumably to make a decision on the rate). On the other hand, it was still an ECB meeting, and there is usually a reaction to such events.
However, after the super-volatile Wednesday, the market returned to its usual, bland movements on Thursday. The euro continued to fall, but it was very weak, albeit entirely predictable. We believe that the euro should fall while the dollar must rise, as the general fundamental background supports the dollar. It is unlikely for the Federal Reserve to start lowering rates in June after the inflation report, while the ECB is almost guaranteed to ease monetary policy this month.
Only one trading signal was formed yesterday. At the beginning of the US session, the pair bounced off the level of 1.0757, after which it dropped by 40 pips. No other signals were generated, and the price did not reach the nearest target level. Therefore, the short position should have been manually closed in the evening. It was possible to earn around 20-30 pips from it.
COT report:
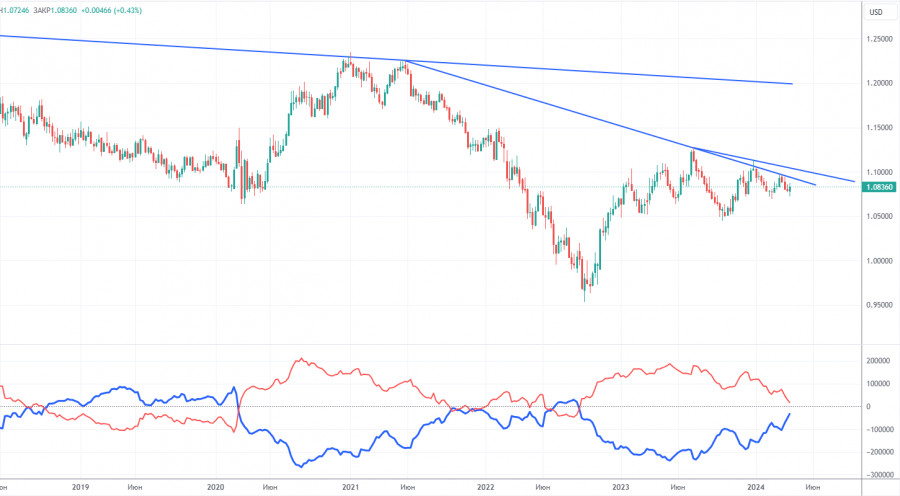
The latest COT report is dated March 26. The net position of non-commercial traders has been bullish for quite some time. Basically, the number of long positions in the market is higher than the number of short positions. However, at the same time, the net position of non-commercial traders (red line) has been decreasing in recent months, while that of commercial traders (blue line) has been increasing. This shows that market sentiment is turning bearish, as speculators increasingly sell the euro. Furthermore, we don't see any fundamental factors that can support the euro's strength, while technical analysis also suggests a downtrend. Three descending trend lines on the weekly chart indicate that there's a good chance of extending the decline.
At present, the red and blue lines are moving towards each other (indicating a trend reversal after a rise). Therefore, we believe that the euro will fall further. During the last reporting week, the number of long positions for the non-commercial group decreased by 2,200, while the number of short positions increased by 15,000. Accordingly, the net position decreased by 17,200. The number of buy contracts is higher than the number of sell contracts among non-commercial traders by only 31,000 (previously 48,000).
Analysis of EUR/USD 1H
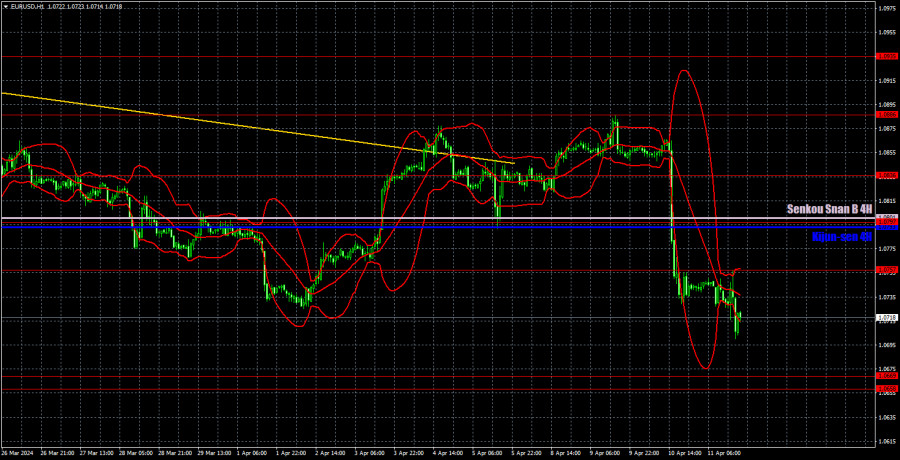
On the 1-hour chart, EUR/USD resumed its downward trend, but the movement calmed down the next day. Since expectations for Fed rate cuts in 2024 have significantly been reduced, the US dollar can and should continue to rise. Especially as the ECB is expected to ease its monetary policy very soon. Practically all the factors currently point to the US dollar's growth.
On April 12, we highlight the following levels for trading: 1.0530, 1.0581, 1.0658-1.0669, 1.0757, 1.0797, 1.0836, 1.0886, 1.0935, 1.1006, 1.1092, as well as the Senkou Span B (1.0801) and Kijun-sen (1.0793) lines. The Ichimoku indicator lines can move during the day, so this should be taken into account when identifying trading signals. Don't forget to set a Stop Loss to breakeven if the price has moved in the intended direction by 15 pips. This will protect you against potential losses if the signal turns out to be false.
Today, German inflation figures for March wrap up the week on the euro area economic calendar. This report objectively has very low chances of influencing market sentiment. The US docket will feature the University of Michigan Consumer Sentiment Index, which may provoke a market reaction only in the case of a significant deviation of the actual value from the forecast. It seems that the market has calmed down after the US inflation data, and now we will see low volatility again every day.
Description of the chart:
Support and resistance levels are thick red lines near which the trend may end. They do not provide trading signals;
The Kijun-sen and Senkou Span B lines are the lines of the Ichimoku indicator, plotted to the 1H timeframe from the 4H one. They provide trading signals;
Extreme levels are thin red lines from which the price bounced earlier. They provide trading signals;
Yellow lines are trend lines, trend channels, and any other technical patterns;
Indicator 1 on the COT charts is the net position size for each category of traders;
The material has been provided by InstaForex Company - www.instaforex.com #


 Download NOW!
No comments:
Post a Comment