
Analyzing the fundamental background (even if there is one) is currently pointless. The pair exhibits such illogical movement that many analysts have stopped trying to explain it. The upward direction, while the Federal Reserve isn't even considering a rate cut and the Bank of England may start lowering rates as early as June, is the most illogical thing on the market right now. The pound is trading, essentially, like Bitcoin. The cryptocurrency is rising because people buy it. The pound strengthens because people buy it. But it is a big question why they buy.
The economic reports cannot answer why the pound is rising. The British economy has been struggling since 2016. Due to Brexit, the economy has already missed out on 150 billion pounds. Taxes are at their highest levels in decades. Economic growth is almost non-existent. Rishi Sunak's government has failed to stabilize the situation. New parliamentary elections will be held in July, after which the majority in Parliament will likely belong to the Labour Party, not the Conservatives. The British public is completely disillusioned with Conservative leaders following the tenures of Boris Johnson, Liz Truss, and Rishi Sunak. Simply put, the economic situation in the UK is constantly deteriorating, so the British are ready to vote for anyone other than the Conservatives in the upcoming elections.
The change of power will inevitably lead to new reforms, possibly altering the political and economic course. Experts are already saying that the government has three options, none of which can be considered pleasant. Either increase the national debt, raise taxes even more, or cut expenses. Given this fundamental background, how the pound can continue to show growth remains unclear.
From a technical perspective, there is no reason to sell the pound on the 4-hour timeframe. But the thing is that it's better not to look at higher timeframes. For instance, the technical picture on the daily chart is so chaotic that it's very difficult to determine what the trend is? In general, the pound continues to trade not "because of" but "despite everything."
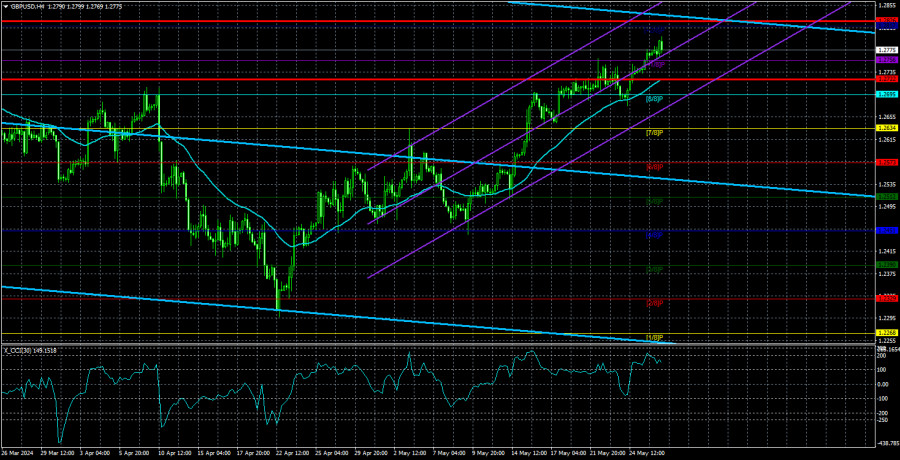
The average volatility of the GBP/USD pair over the last 5 trading days is 52 pips. This is considered a low value for the pair. Therefore, we expect the pair to trade within a range bounded by the levels of 1.2722 and 1.2826. The long-term linear regression channel is pointing downwards, suggesting a downward trend. The CCI indicator entered the oversold zone three times in April, and the British currency surged. However, this correction should have ended a long time ago.
Nearest support levels:
S1 - 1.2756
S2 - 1.2695
S3 - 1.2634
Nearest resistance levels:
R1 - 1.2817
Trading Recommendations:
The GBP/USD pair continues its upward movement against all odds. However, we still expect downward movement, but with the current paradoxical rise of the British currency, we may have to wait a long time. Buying the British pound when the price exits the sideways channel through the lower boundary is not relevant. Currently, it is advisable to wait for the price to firmly consolidate below the moving average before you consider selling. If we consider trading solely based on technical analysis and only on the 4-hour timeframe, long positions are relevant with targets at 1.2817 and 1.2826.
Explanation of Illustrations:
* Linear Regression Channels – Helps determine the current trend. If both are directed in the same direction, it means the trend is currently strong.
* Moving Average Line (settings 20.0, smoothed) – Determines the short-term trend and the direction in which trading should currently be conducted.
* Murray Levels – Target levels for movements and corrections.
* Volatility Levels (red lines) – The probable price channel in which the pair will spend the next day, based on current volatility indicators.
* CCI Indicator – Its entry into the oversold area (below -250) or the overbought area (above +250) means that a trend reversal in the opposite direction is imminent.
Pentru mai multe detalii, va invitam sa vizitati stirea originala.


 Download NOW!
No comments:
Post a Comment