Analysis of EUR/USD 5M

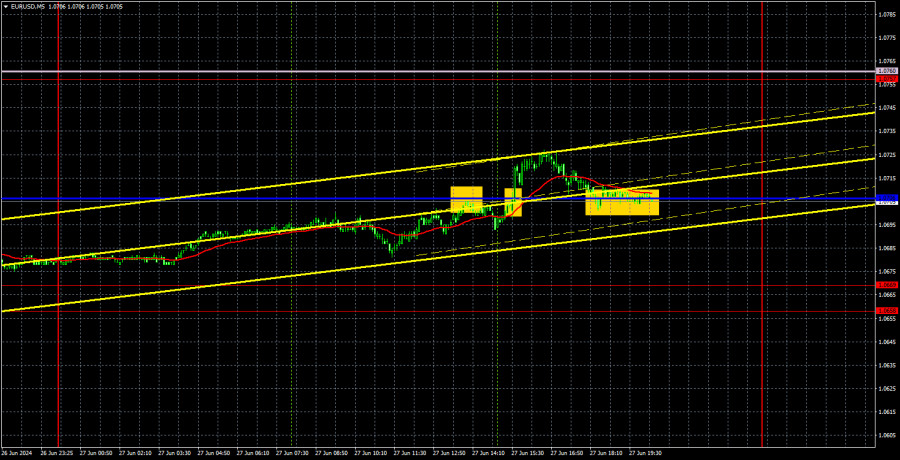
Yesterday, EUR/USD rebounded from the 1.0669 level for the third time and it started a new upward movement within the horizontal channel, which has been ongoing for two weeks. As we mentioned at the beginning of the week, the correction could last for quite some time. As long as the price remains stuck in a horizontal channel, the trend is on hold. Also, we wish to remind you that if the price stays inside the horizontal channel, this doesn't mean that the pair will constantly reach the upper or lower boundaries. As observed, the price has reached the lower boundary thrice, while it hit the upper boundary only once. Therefore, a rebound from the lower boundary does not mean that the price will immediately rise to the upper boundary.
The US just released the first notable reports of the week, but it didn't affect the current technical picture. The third estimate of GDP numbers for Q1 matched experts' forecasts at +1.4%. Orders for durable goods turned out slightly better than forecasts, but the previous value was revised downward, so overall, this was considered a weak report. Overall, the dollar moderately fell on this data, but it would have done so anyway since the price did not breach the 1.0669 level.
Two trading signals were formed yesterday, and traders could safely ignore each of them. Remember, the Ichimoku indicator lines have no power in flat conditions. The Ichimoku indicator is a trend indicator. Therefore, breaches or bounces off the Kijun-sen line had no power. If any signal was worth trading, it would have been the bounce from the 1.0669 level, which had formed days earlier, and we also mentioned this in our articles.
COT report:

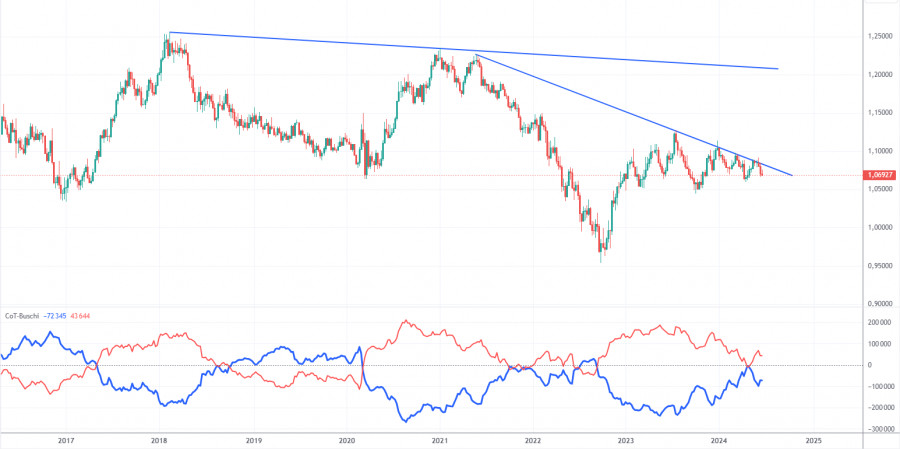
The latest COT report is dated June 11. The net position of non-commercial traders has remained bullish for a long time, and we're still dealing with the same situation. The bears' attempt to gain dominance failed miserably. The net position of non-commercial traders (red line) has been declining in recent months, while that of commercial traders (blue line) has been growing. But now we're seeing the opposite once again. This shows that buyers, not sellers, are currently gaining momentum again. This might be temporary since the downward trend is still valid.
We don't see any fundamental factors that can support the euro's strength in the long term, while technical analysis also suggests a continuation of the downtrend. Three descending trend lines on the weekly chart suggests that there's a good chance of further decline.
The red and blue lines are currently moving away from each other again, which indicates a build-up in long positions on the euro. During the last reporting week, the number of long positions for the non-commercial group decreased by 1,200, while the number of short positions increased by 23,000. Accordingly, the net position decreased by 14,200. We may witness the start of increasing bearish pressure. According to the COT reports, the euro has a lot of potential to fall.
Analysis of EUR/USD 1H

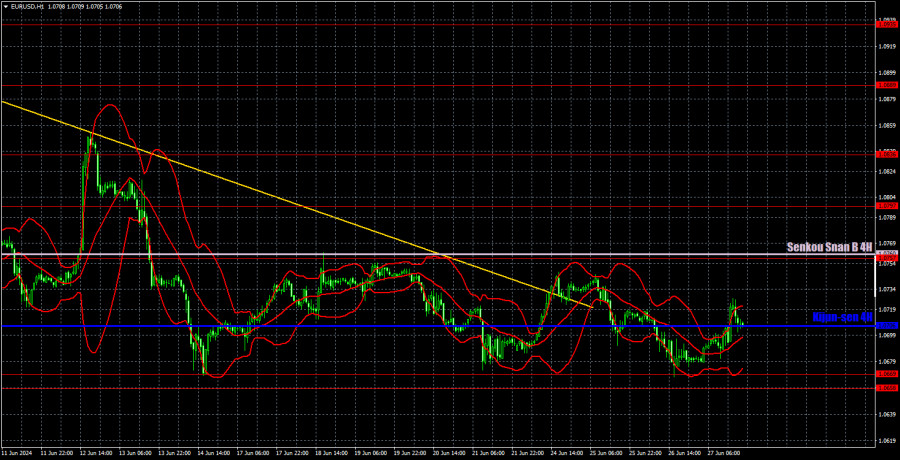
On the 1-hour chart, EUR/USD continues to form a new downtrend, which is part of the global trend. We still expect the single currency to fall, but the pair is currently going through a correction, and it may last for another week. Volatility has completely dropped, making it quite difficult to conduct analysis and trading. Sell signals are necessary to start a new wave of the downtrend, and there are currently none of those – the price is trading in a horizontal range.
On June 28, we highlight the following levels for trading: 1.0530, 1.0581, 1.0658-1.0669, 1.0757, 1.0797, 1.0836, 1.0889, 1.0935, 1.1006, 1.1092, as well as the Senkou Span B (1.0760) and Kijun-sen (1.0706) lines. The Ichimoku indicator lines can move during the day, so this should be taken into account when identifying trading signals. Don't forget to set a Stop Loss to breakeven if the price has moved in the intended direction by 15 pips. This will protect you against potential losses if the signal turns out to be false.
On Friday, in the Eurozone, the unemployment rate and changes in the number of unemployed in Germany may garner investor interest but these are secondary data. The US docket will feature reports on the Personal Consumption Expenditure index, personal income, personal spending, and the consumer sentiment index. The market will focus on the first and fourth reports.
Description of the chart:
Support and resistance levels are thick red lines near which the trend may end. They do not provide trading signals;
The Kijun-sen and Senkou Span B lines are the lines of the Ichimoku indicator, plotted to the 1H timeframe from the 4H one. They provide trading signals;
Extreme levels are thin red lines from which the price bounced earlier. They provide trading signals;
Yellow lines are trend lines, trend channels, and any other technical patterns;
Indicator 1 on the COT charts is the net position size for each category of traders;
The material has been provided by InstaForex Company - www.instaforex.com #


 Download NOW!
No comments:
Post a Comment