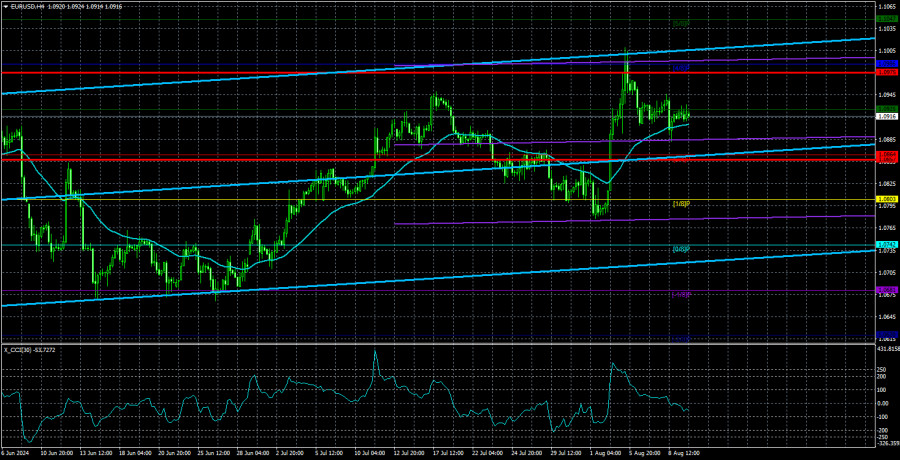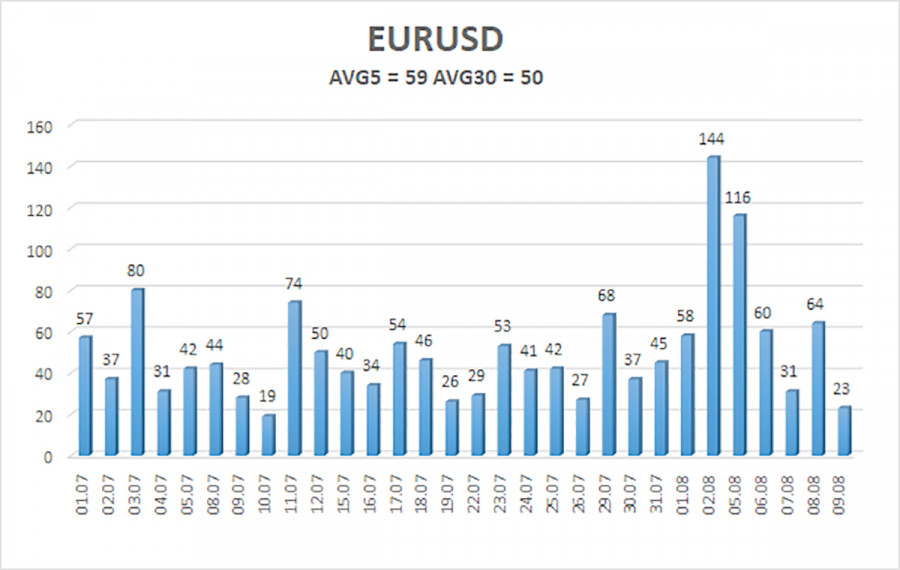
The EUR/USD pair showed no interesting movements or desire to trade on Friday. The daily volatility was 23 pips, which says a lot. In general, the pair stayed in one place all day. However, it remained above the moving average line in the 4-hour time frame, so the upward trend is intact. Recall that the latest dollar slump followed weak unemployment and Non-Farm Payroll reports in the U.S. At the same time, the quotes have stayed on the horizontal channel of 1.0600-1.1000, where they have been for seven months. Thus, the main question for the new week will be whether the dollar can sustain its expected growth within the horizontal channel with a target of 1.0600.
To answer this question, we should first consider the macroeconomic background. There will be several reports in the European Union that might attract traders' attention. If we exclude all secondary data (such as ZEW indices), only the GDP for the second quarter and industrial production remain. However, even these reports cannot be called "significant." The GDP report will be released in its second estimate, which is the least important of the three. Therefore, no significant market reaction is expected. In addition, compared to the first estimate, the forecast for the indicator has not changed. The European economy may grow by 0.3%, which is very modest. However, the market is not concerned with the pace of growth in the European economy right now. Only with the American economy, only with the American economy!
The American economy is growing, and it appears it is not about to enter a recession. At least the same second quarter shows a growth of 2.8%. The market, which has been waiting for the Federal Reserve to lower the key rate for seven months, subconsciously understands that high economic growth gives the Fed additional time. In other words, there is no need to rush with monetary policy easing if the economy is doing well. The economy is doing well if you disregard the non-farm payrolls and unemployment rate. But ultimately, which data is more important? Labor market data or overall economic data?
But help for the dollar bears might come from the old, reliable, much-loved report on U.S. inflation. We have highlighted it separately because, in recent months, even a minimal slowdown in the indicator has triggered a collapse in the U.S. currency. This time, official forecasts predict a minor slowdown in core and underlying inflation by 0.1% in July. Imagine what might happen if inflation slows by 0.2% to 2.8%! For the first time in several years, it could drop below 3%. The probability of a monetary policy easing in September would immediately soar to 100%, and with it, the U.S. dollar would plummet (only to the bottom). Therefore, the inflation report is the most dangerous factor for the greenback, not the European GDP or industrial production data. Inflation could once again throw the market off course. However, in any case, it is unlikely that we should expect a new upward or downward trend until the pair exits the horizontal channel.

The average volatility of EUR/USD over the past five trading days as of August 12 is 59 pips, which is considered average. We expect the pair to move between the levels of 1.0857 and 1.0975 on Monday. The higher linear regression channel is directed upwards, but the global downtrend remains intact. The CCI indicator entered the overbought area for the second time, again warning of a potential shift to a downtrend.
Nearest Support Levels:
- S1 – 1.0864
- S2 – 1.0803
- S3 – 1.0742
Nearest Resistance Levels:
- R1 – 1.0925
- R2 – 1.0986
- R3 – 1.1047
Trading Recommendations:
The EUR/USD pair maintains a global downward trend and in the 4-hour time frame, it started a bearish correction, which could mark the start of a new wave of the downtrend. In previous reviews, we mentioned that we are only expecting declines from the euro. We do not believe the euro can start a new global trend amid the European Central Bank's monetary policy easing, so the pair will likely fluctuate between 1.0600 and 1.1000 for some time. For now, it appears as though the price has bounced off the upper boundary of the horizontal channel and is heading towards the lower boundary.
Explanations for Illustrations:
Linear Regression Channels: help determine the current trend. If both are directed in the same direction, it means the trend is strong.
Moving Average Line (settings 20,0, smoothed): determines the short-term trend and the direction in which trading should be conducted.
Murray Levels: target levels for movements and corrections.
Volatility Levels (red lines): the probable price channel in which the pair will spend the next 24 hours, based on current volatility indicators.
CCI Indicator: Entering the oversold area (below 250) or the overbought area (above +250) means a trend reversal is approaching.
The material has been provided by InstaForex Company - www.instaforex.com #


 Download NOW!
No comments:
Post a Comment