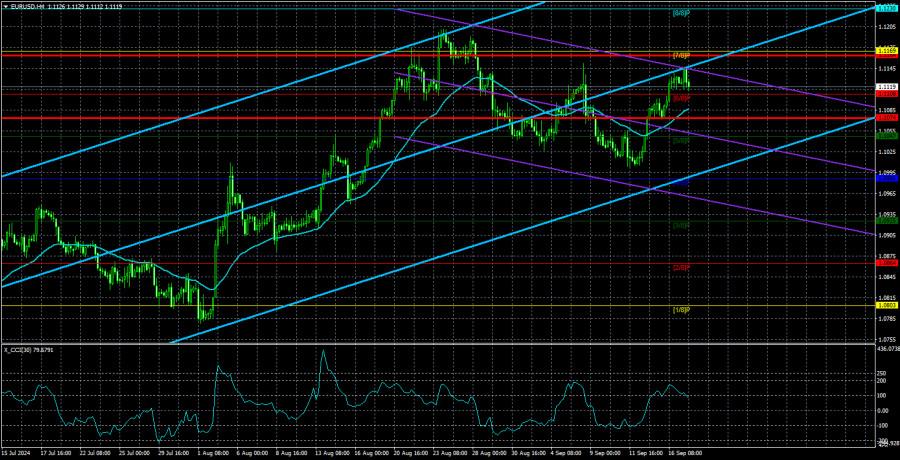
The EUR/USD pair traded quite calmly again on Tuesday but still appreciated slightly throughout the day. Essentially, we see the same picture daily— the euro keeps rising for any reason or even without one. Looking at the 4-hour time frame, it's clear that the euro has been in a corrective phase over the past few weeks, so the statement "the euro is constantly rising" might seem strange to some. However, we'd like to remind you that the euro has been rising for two years. Of course, this is brief for a global trend (for instance, the pound has been falling for 16 years), but in 2024, it's hard to find reasons for such a movement. The market continues to price in all future Federal Reserve rate cuts, while all other factors (especially those supporting the dollar) don't seem to matter.
In practice, it looks something like this: another report is released in the U.S. that turns out weaker than the often overestimated forecasts, and the market sells the dollar— quite predictable. Then, no reports were released for a while, yet the euro still rose. Then, the European Central Bank lowers rates— and the euro rises. Inflation in the Eurozone falls to the target level— the euro increases again. After that, we might see a two-week pause and a correction of 150-200 pips. And then the euro rises again. This week, there hasn't been a single important report published that would indicate euro strength and dollar weakness. Yesterday morning, Germany's ZEW economic sentiment index came out five times lower than expected. The euro still rose. A similar index for the Eurozone turned out to be twice as bad as forecast— yet the euro kept climbing.
Thus, the macroeconomic backdrop remains completely irrelevant. The market continues to price in the Fed's rate cut, and so far, nothing has been able to stop it. This week, we will see whether the market has anticipated the first easing. If it has, then today, the dollar may rise on any decision from the Fed, which would appear illogical. But let's remember that just a week ago, the ECB also cut rates, yet the euro rose again. Therefore, the currency's growth during monetary policy easing is a perfectly normal scenario in 2024.
What else can be said about today's Fed meeting? Of course, the "dot-plot" chart will matter, Fed Chair Jerome Powell's speech will matter, and the central bank's stance on the rate will matter. However, predicting what these outcomes will be is impossible. Thus, by the end of the week, the dollar could strengthen back to the 10th level or continue its steep decline from the past few months.
Since the price is currently above the moving average, a rise in the pair seems more likely. However, the Fed meeting is a significant event that could trigger any market reaction.

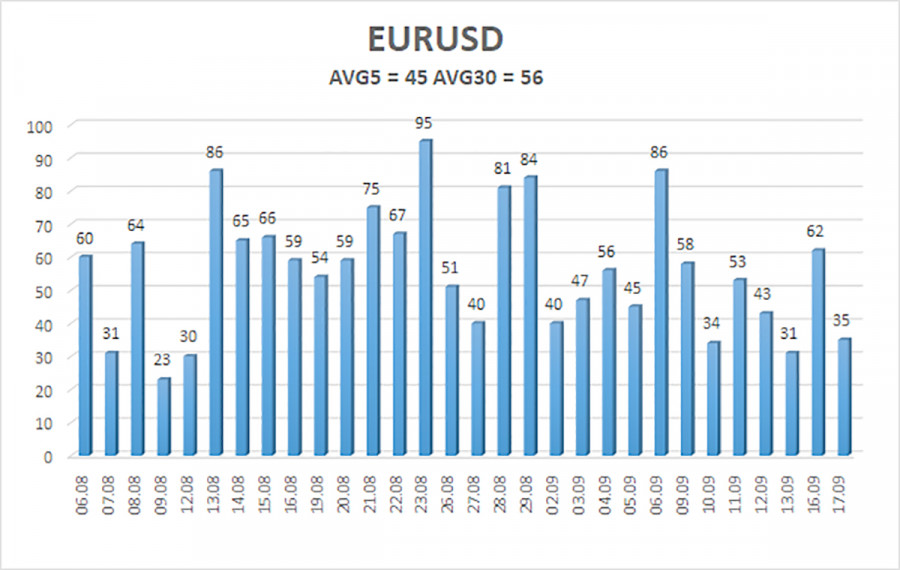
The average volatility of EUR/USD over the past five trading days as of September 18 is 45 pips, which is considered "moderately low." We expect the pair to move between the levels of 1.1074 and 1.1164 on Wednesday. The upper linear regression channel points upward, but the overall downtrend persists. The CCI indicator entered the overbought area three times, signaling a potential shift to a downtrend and the illogical recent rise. However, we have only seen a weak correction so far.
Nearest Support Levels:
- S1 – 1.1108
- S2 – 1.1047
- S3 – 1.0986
Nearest Resistance Levels:
- R1 – 1.1169
- R2 – 1.1230
- R3 – 1.1292
Trading Recommendations:
The EUR/USD pair continues its not-too-strong downward movement with frequent and strong pullbacks upward. In recent reviews, we mentioned that we expect only a decline from the euro in the medium term, as any new growth would seem absurd. There is a chance that the market has already priced in all future Fed rate cuts. If so, the dollar has no further reason to fall. Short positions can be considered if the price consolidates below the moving average, with targets at 1.0986 and 1.0925. Macroeconomic data from the U.S. continue to complicate things for the dollar while the market is still in no hurry to buy it.
Explanations for Illustrations:
Linear Regression Channels: help determine the current trend. If both are pointed in the same direction, this indicates a strong trend.
Moving Average Line (settings 20,0, smoothed): defines the short-term trend and the direction in which trading should be conducted.
Murray Levels: target levels for movements and corrections.
Volatility Levels (red lines): the probable price channel in which the pair will spend the next 24 hours, based on current volatility indicators.
CCI Indicator: Entry into the oversold area (below -250) or the overbought area (above +250) indicates an impending trend reversal in the opposite direction is approaching.
The material has been provided by InstaForex Company - www.instaforex.com #


 Download NOW!
No comments:
Post a Comment