The GBP/USD currency pair traded fairly calmly on Wednesday, though with a significant decline. The inflation report strengthened the dollar, which makes us very happy. However, this article isn't about that report, which has been the focus of discussions for over a week. Instead, we would like to draw attention to a series of macroeconomic reports from the UK.
On Tuesday, reports on wages, unemployment, and jobless claims were released in the UK. We're not claiming that these are "super-important" reports. We mentioned that no significant reaction should be expected. The same applies to Wednesday's reports – GDP and industrial production. Despite all the talks about the British economy's recovery, GDP did not grow in July. Industrial production decreased by 0.8%. Yes, the reports on Tuesday were more optimistic, so perhaps it is fair that the pound neither rose nor fell after the whole package of macroeconomic data. However, we would note the market's almost complete disregard for this data package.
It feels as if the market is not interested at all in Britain, its data, or the Bank of England's monetary policy. The British central bank began easing, which had no effect – the pound continues to rise. The UK's macroeconomic data have been facing serious challenges over the past two years, yet everyone seems only to be talking about the weakness of the U.S. economy, which grows by several percent each quarter. Thus, it seems fair to suggest that it's not the pound sterling rising but the dollar constantly falling.
We've already discussed why the dollar is falling many times. This week has only again shown us that the market doesn't care about reports from the UK or whether the BoE is raising or lowering rates. Everything boils down not even to the U.S. economy itself but to the market's expectations about this economy and the Fed's monetary policy.
But here, it's even more straightforward. The Fed hasn't reduced the key rate a single time, yet the dollar has fallen for two years. If it started declining when inflation began slowing down, logically, it should stop falling when inflation stabilizes around 2%. That's why, as before, we expect the dollar to rise. We believe there were reasons for its decline since October 2022, but not for such a steep drop. The market has overreacted, and now it's time to restore a fair exchange rate.
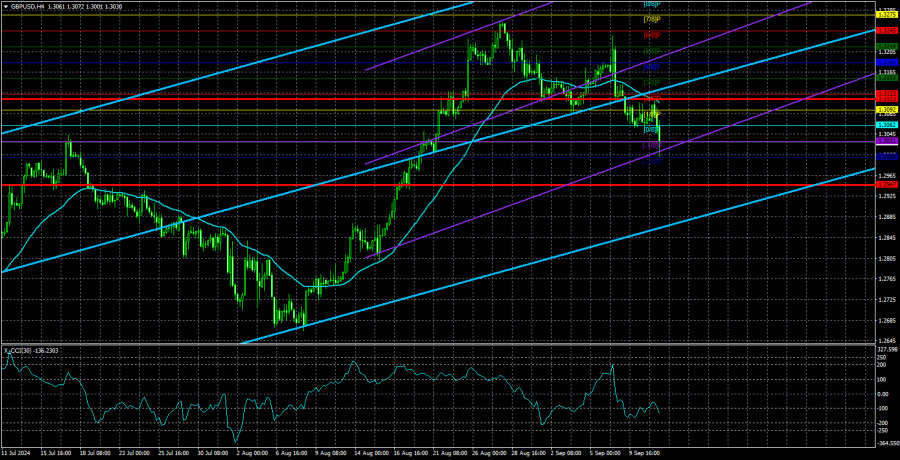
At the moment, it's difficult to say that a new global downward trend has begun. The price barely crosses the moving average occasionally (and rarely), and it still isn't in a hurry to decline. We believe a global decline in the British currency should be expected after the Fed lowers the rate at least once. That will remove the psychological barrier. However, it's also unrealistic to expect the global drop in the pair to start on September 19.

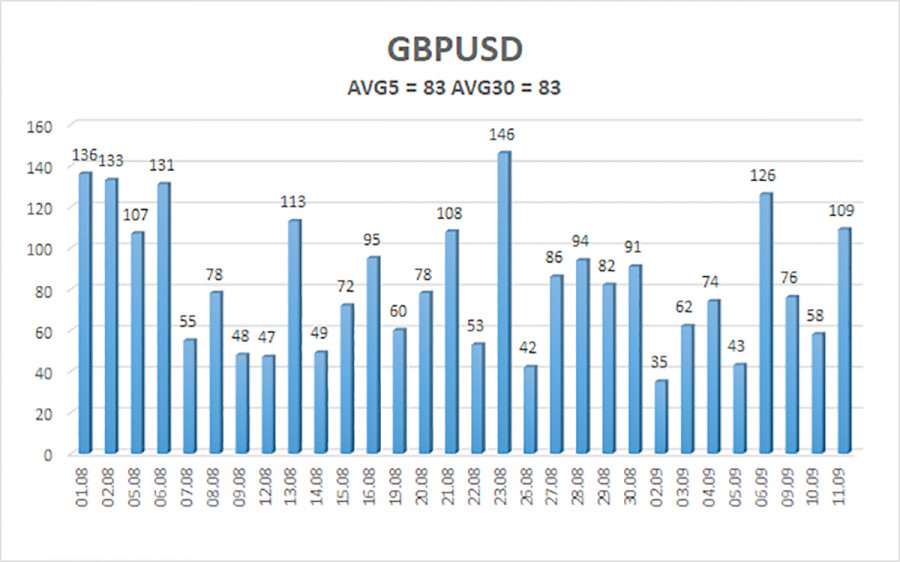
The average volatility of the GBP/USD pair over the past five trading days is 83 pips, which is considered average for this pair. Therefore, on Thursday, September 12, we expect movement within a range limited by the levels of 1.2947 and 1.3113 . The upper linear regression channel is directed upwards, signaling the continuation of the upward trend. The CCI indicator has formed four bearish divergence, suggesting a significant drop.
Nearest Support Levels:
- S1 – 1.3031
- S2 – 1.3000
Nearest Resistance Levels:
- R1 – 1.3062
- R2 – 1.3092
- R3 – 1.3123
Trading Recommendations:
The GBP/USD pair has taken the first step towards a downtrend, and we hope this won't be the only one. We are not considering long positions now, as we believe that the market has repeatedly factored in all the bullish factors for the British currency (which are not much). Short positions can be considered with targets at 1.2939 and 1.2878, as the price has once again consolidated below the moving average. However, last week's U.S. macroeconomic data again put pressure on the dollar, and the market may continue to work on easing the Fed's monetary policy in the future. Caution is advised.
Explanations for Illustrations:
Linear Regression Channels: help determine the current trend. If both are directed in the same direction, it indicates a strong trend.
Moving Average Line (settings 20,0, smoothed): defines the short-term trend and the direction in which trading should be conducted.
Murray Levels: target levels for movements and corrections.
Volatility Levels (red lines): the probable price channel in which the pair will spend the next 24 hours, based on current volatility indicators.
CCI Indicator: Entering the oversold area (below -250) or the overbought area (above +250) indicates an impending trend reversal in the opposite direction.
The material has been provided by InstaForex Company - www.instaforex.com #


 Download NOW!
No comments:
Post a Comment