EUR/USD Analysis on July 25th

The premium article will be available in00:00:00

25.07.2024 04:28 PM


On Wednesday, the EUR/USD pair retraced to the 76.4% Fibonacci corrective level at 1.0822. The rebound from this level supported the US dollar and resumed the decline towards the 61.8% Fibonacci level at 1.0822. A consolidation above the 1.0858 level could indicate a more significant rise for the euro. The pair has settled below the trend channel, but bears may only have enough momentum for a corrective wave. The wave situation has become slightly more complex but remains


Fresh articles are available only to premium users


Read analytics in early access, getting information first
Get

Pentru mai multe detalii, va invitam sa vizitati stirea originala.

Key events on July 25: fundamental analysis for beginners

Analysis of macroeconomic reports:


Several macroeconomic events are scheduled for Thursday. The economic calendar is light for the Eurozone, Germany, and the UK, but the US will release three relatively important indicators. The US GDP report does not always provoke any market reaction, but it should not be ignored, as it shows the state of the American economy. The durable goods orders report is vital because these goods are costly, and changes in sales volumes reflect consumers' willingness or unwillingness to make large purchases. The unemployment claims report is the least important of all.

Analysis of fundamental events:


From Thursday's fundamental events, only a speech by European Central Bank President Christine Lagarde stands out. It is challenging to expect new statements from her that the market has yet to hear. However, the tone of her speech may indicate how prepared the ECB is to lower key rates for the second time in September. We believe that Lagarde will not hint at the September meeting today and will again limit herself to the phrase "everything will depend on incoming information."


General conclusions:


Today, notable events include Lagarde's speech and US data. All three events could provoke a market reaction. It is impossible to predict the direction in which both pairs will move after these events. Therefore, one should be prepared for movement in either direction. A decline in both currency pairs seems likely, but bullish corrections are still possible.

Basic rules of a trading system:


1) The strength of a signal is determined by the time it took for the signal to form (bounce or level breakthrough). The shorter the time required, the stronger the signal.

2) If two or more trades around a certain level are initiated based on false signals, subsequent signals from that level should be ignored.

3) In a flat market, any currency pair can produce multiple false signals or none at all. In any case, it's better to stop trading at the first signs of a flat market.

4) Trades should be opened between the start of the European session and mid-way through the U.S. session. All trades must be closed manually after this period.

5) In the hourly time frame, trades based on MACD signals are only advisable amidst substantial volatility and an established trend, confirmed either by a trendline or trend channel.

6) If two levels are too close to each other (from 5 to 20 pips), they should be considered as a support or resistance zone.

7) After moving 15 pips in the intended direction, the Stop Loss should be set to break-even.

What the charts show:


Support and Resistance price levels can serve as targets when buying or selling. You can place Take Profit levels near them.

Red lines represent channels or trend lines that depict the current trend and indicate the preferred trading direction.

The MACD (14,22,3) indicator, encompassing both the histogram and signal line, acts as an auxiliary tool and can also be used as a source of signals.

Important speeches and reports (always noted in the news calendar) can profoundly influence the price dynamics. Hence, trading during their release calls for heightened caution. It may be reasonable to exit the market to prevent abrupt price reversals against the prevailing trend.

Beginners should always remember that not every trade will yield profit. Establishing a clear strategy, coupled with effective money management, is key to long-term success in trading.Pentru mai multe detalii, va invitam sa vizitati stirea originala.

Technical Analysis of Intraday Price Movement of Nasdaq 100 Index, Thursday July 25, 2024.

#

analytics66a1b4b0239f0.jpg

With the appearance of deviations between the price movement of the Nasdaq 100 index and the Awesome Oscillator indicator on the 4-hour chart, in the near future #NDX has the potential to be corrected and strengthen upwards to test the resistance level of 19697.0 if this level succeeds in holding back the rate of strengthening correction and as long as it does not succeed in breaking above the level 19922.1 then #NDX has the potential to continue weakening again and will weaken again down to level 18813.0 as the main target and if momentum and volatility support then level 18180.2 will be the next target to aim for.

(Disclaimer)

The material has been provided by InstaForex Company - www.instaforex.com #

USD/JPY: What's going on with the yen?

#

The US dollar showed mixed dynamics on Wednesday. The US Dollar Index initially reached a two-week high of 104.27 but then reversed and moved the other way. Major dollar pairs are adjusting accordingly, following the greenback's lead. However, the USD/JPY pair is moving downward regardless of whether the dollar appreciates or depreciates. This "anomaly" is attributed to several reasons.

analytics66a0f7b3be0a1.jpg

Let's start with the fact that Japanese authorities conducted two consecutive currency interventions two weeks ago when the USD/JPY pair approached the 162 level. According to Japanese news agency Kyodo, a currency intervention of $22 billion was carried out on July 11, followed by another intervention worth $13 billion on July 12. Representatives of the government and monetary authorities have remained silent: the Ministry of Finance and the Bank of Japan have yet to announce the intervention, and all related questions are left unanswered (typically, Japan's authorities announce interventions several months later).

This means that the USD/JPY pair started to decline based on quite strong fundamental reasons.

Furthermore, the greenback reinforced the downward trend, which came under significant pressure due to the slowdown in the US CPI and dovish rhetoric from Federal Reserve Chair Jerome Powell. The probability of a rate cut at the September meeting has risen to 95%, and the chances of an additional cut in November or December are assessed by the market as 50/50.

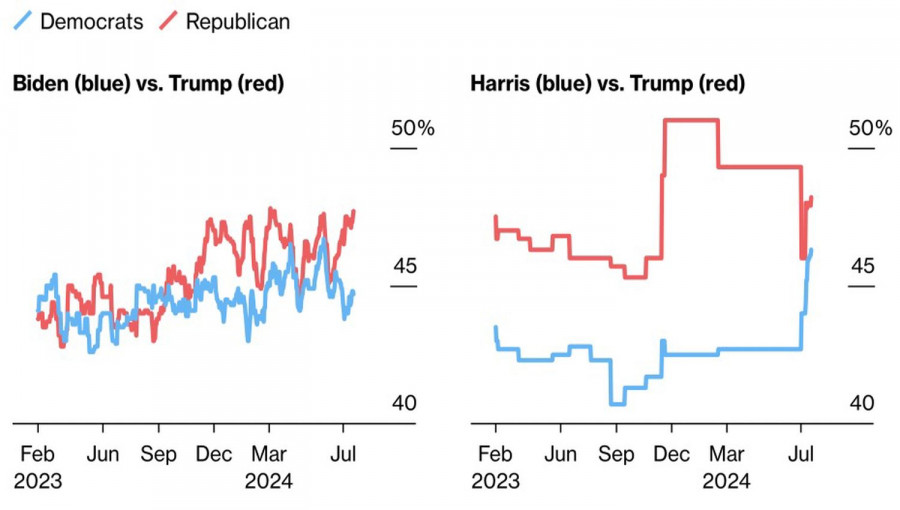
Donald Trump helped the US dollar recover last week by strengthening his position in the election race. However, firstly, this "help" was short-lived (Trump's chances of winning slightly decreased after Biden exited the race), and secondly, USD/JPY traders effectively ignored the greenback's growth. Buyers could only manage a modest correction, allowing bears to enter sell positions at a more favorable price.

This week, the USD/JPY pair continues to follow its own path. Whether the greenback appreciates or depreciates, the price stubbornly maintains its downward course. What drives such persistence from sellers? Will the effect of the (unconfirmed) currency intervention last for the third consecutive week?

In my opinion, the primary driving force behind the downward movement is the hawkish rumors regarding potential actions by the Bank of Japan at its July meeting. The meeting is scheduled to take place exactly one week from now, on July 30 and 31.

Market confidence is growing that the Japanese central bank will increase the interest rate by 10 basis points, taking another step towards normalizing monetary policy. The reason is persistent inflation, which still exceeds the bank's target level.

According to data published last week, the overall Consumer Price Index rose by 2.8% year-on-year in June, remaining at the same level as the previous month. The core index, excluding fresh food, increased by 2.6% (the highest value in the past three months) after rising by 2.5% in May. Inflation, excluding food and energy, was 2.2% (compared to 2.1% in May).

The key inflation indicator tracked by the Bank of Japan has been above the two-percent target for over two years and has even accelerated over the last two months (May and June).

Bank of Japan officials have recently expressed their concern about rising inflation, suggesting the possibility of tightening monetary policy. In particular, the head of the Central Bank, Kazuo Ueda, mentioned in one of his speeches that the regulator might raise the interest rate at one of the upcoming meetings. Notably, these remarks were made before the publication of June CPI data, which reflected an acceleration in core inflation.

The combination of these fundamental factors is driving the USD/JPY pair downward. This downward trend could intensify significantly if the U.S. economic growth data for the second quarter and the PCE core index growth report fall into the "red ." These crucial reports are scheduled for release on Thursday and Friday, and their outcomes could have a substantial impact on the USD/JPY pair.

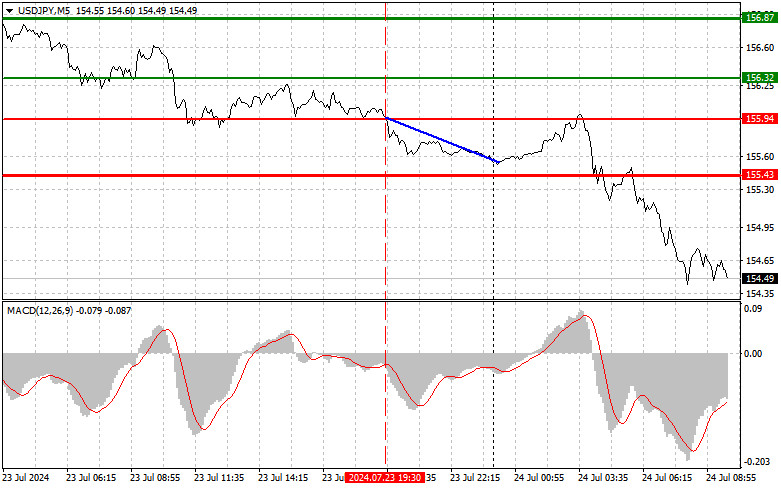
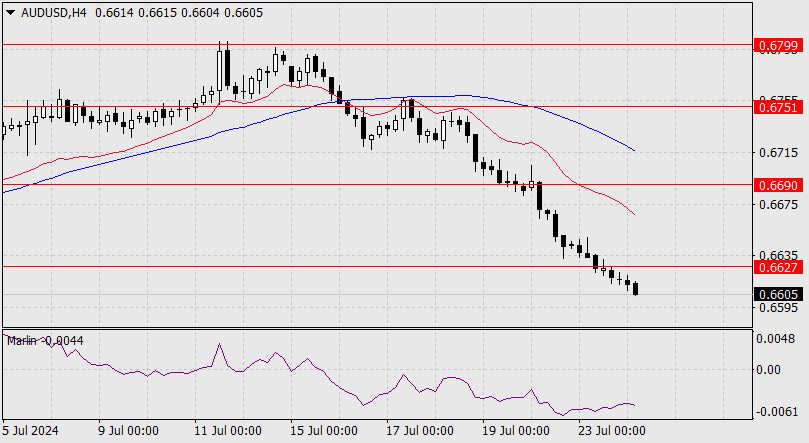
From a technical standpoint, the USD/JPY pair is currently positioned at the lower line of the Bollinger Bands indicator on the H4 and D1 timeframes, below all lines of the Ichimoku indicator, which has formed a bearish "Parade of Lines" signal. On the weekly chart, the Ichimoku indicator will also form this signal once the pair crosses the 154.00 target (Kijun-sen line). In other words, the "technical" aspect also suggests a priority for short positions, with targets at 153.50 and 153.00. Given the strength of the downward movement, it is highly likely that these levels will be tested this week, unless the aforementioned U.S. macroeconomic reports intervene and support the struggling dollar.

The material has been provided by InstaForex Company - www.instaforex.com #

Dollar Faces Volatility Amid Trump's Uncertain Election Lead

An interesting confrontation is shaping up in the US presidential race. With Joe Biden dropping out, a strong opponent has emerged for the Republican candidate. The rising popularity of Kamala Harris has made investors step back from Trump trading, allowing EUR/USD to find some footing. The bulls were still being determined even by weak European business activity data.

A Morning Consult poll showed that Joe Biden's exit from the race narrowed the gap between the main Democratic candidate and the Republican from 6 to 2 percentage points. The NPR/PBS News/Marist poll indicates a one-point difference, while a Reuters/Ipsos survey shows Kamala Harris leading Donald Trump by two percentage points. Republicans called this the honeymoon period for the new Democratic nominee, but it's noteworthy that Democrats started strong, raising $100 million in donations.

Dynamics of Presidential Candidates' Ratings

If former prosecutor Harris manages to expose Trump, who faces 34 charges, and wins the election, everything will fall into place. She is already making strides. As vice president, she won't interfere with the Federal Reserve's policies, allowing the central bank to lower the federal funds rate as expected in September. The chances of a rate cut in September returned to 100% after the presidential candidate ratings were published, having dropped to 94% just a few days ago.

Simultaneously, the US dollar is retreating. EUR/USD bulls weren't deterred even by the unexpected slowdown in the Eurozone's composite PMI for July, which fell to 50.1, the lowest since February. Germany and France were the main culprits, with business activity falling below the critical 50 mark, indicating potential economic contraction.

Dynamics of European Business Activity

This shouldn't come as a surprise. The political crisis in France hasn't fully subsided, and Donald Trump's potential victory in the November elections increases the likelihood of a 60% tariff on imports from China. This would slow down China's GDP and the export-oriented Eurozone. A trade war would be especially painful for Germany, which accounts for half of the EU's exports to the largest Asian economy.

However, with Kamala Harris joining the presidential race, a Republican victory no longer seems guaranteed. The fight for the White House is ahead, and investors need to adjust their Trump-trading strategies accordingly.

Technically, a pin bar might be forming on the daily EUR/USD chart. If this happens, it could signal an opportunity to add long positions from the 1.083 level on a breakout above the bar's high near 1.086. There are chances for an upward trend resumption, but consolidation of the pair seems the most likely scenario.Pentru mai multe detalii, va invitam sa vizitati stirea originala.

GBP/USD: Trading Plan for the US Session on July 24th (Review of Morning Trades). The Pound Rose After PMI Data

Back
Trading plan


Back
Trading plan


GBP/USD: Trading Plan for the US Session on July 24th (Review of Morning Trades). The Pound Rose After PMI Data


In my morning forecast, I focused


The premium article will be available in
00:00:00

24.07.2024 04:34 PM


The premium article will be available in00:00:00

24.07.2024 04:34 PM


In my morning forecast, I focused on the level of 1.2906 and planned to make market entry decisions from there. Let's examine the 5-minute chart to see what happened. A rise and the formation of a false breakout led to a sell signal for the pound, but as you can see from the chart, a major sell-off has not yet occurred. The technical picture was slightly revised for the second half of the day.For Opening Long Positions on GBP/USD:Fairly good


Fresh articles are available only to premium users


Read analytics in early access, getting information first
Get

Pentru mai multe detalii, va invitam sa vizitati stirea originala.

EUR/USD: Trading Plan for the US Session on July 24th (Review of Morning Trades)

Back
Trading plan


Back
Trading plan


EUR/USD: Trading Plan for the US Session on July 24th (Review of Morning Trades)


I focused on the 1.0834 level


The premium article will be available in
00:00:00

24.07.2024 03:18 PM


The premium article will be available in00:00:00

24.07.2024 03:18 PM


I focused on the 1.0834 level in my morning forecast and planned market entry decisions based on this level. Let's examine the 5-minute chart to understand the developments. A decline and the formation of a false breakout provided a buying opportunity for the euro; however, at the time of writing, the movement had been only about 12 points. The technical outlook was revised for the second half of the day.For Opening Long Positions on EURUSD:The euro declined further in response


Fresh articles are available only to premium users


Read analytics in early access, getting information first
Get

Pentru mai multe detalii, va invitam sa vizitati stirea originala.

USD/JPY: trading tips for beginners for the European session on July 24

Overview of trading and tips on USD/JPY

The price test of 155.94 occurred when the MACD indicator started falling from the zero mark, confirming the correct entry point to sell the dollar. As a result, USD/JPY continued to fall along the downward trend, yielding a profit of about 30 pips. Today, the dollar is expected to lose ground despite disappointing manufacturing data, which fell below 50 points, indicating a contraction. However, solid figures in the services sector offset the report above, boosting Japan's composite PMI. It is best to continue trading according to the downward trend but be highly cautious with short positions at the current weekly lows, as demand for the dollar could return at any moment—especially since other risk assets are again starting to lose value in tandem with it. As for the intraday strategy, I will rely more on implementing scenarios No. 1 and 2.

Buy signals

Scenario No. 1. Today, I plan to buy USD/JPY when the price reaches the entry point around 154.85 plotted by the green line on the chart, with the goal of rising to the level of 155.86 plotted by the thicker green line on the chart. Around 155.86, I'm going to exit long positions and open short ones in the opposite direction, expecting a movement of 30-35 pips in the opposite direction from that level. You can count on the pair to rise today, but it's better to act as low as possible. Before buying, make sure that the MACD indicator is above the zero mark and is just starting to rise from it.

Scenario No. 2. I also plan to buy USD/JPY today in case of two consecutive tests of 154.05 when the MACD indicator is in the oversold area. This will limit the pair's downward potential and lead to a reverse market upturn. One can expect growth to the opposite levels of 154.85 and 155.86.

Sell signals

Scenario No. 1. I plan to sell USD/JPY today only after testing the level of 154.05 plotted by the red line on the chart, which will lead to a rapid decline in the price. The key target for sellers will be 153.15, where I am going to exit short positions and immediately open long ones in the opposite direction, expecting a movement of 20-25 pips in the opposite direction from that level. Pressure on USD/JPY may return at any moment, especially in case the price fails to consolidate around the intraday high. Before selling, make sure that the MACD indicator is below the zero mark and is just starting to decline from it.

Scenario No. 2. I also plan to sell USD/JPY today in case of two consecutive price tests at 154.85 when the MACD indicator is in the overbought area. This will limit the pair's upward potential and lead to a reverse market downturn. One can expect a decline to the opposite levels 154.05 and 153.15.

What's on the chart:

The thin green line is the entry price at which you can buy the trading instrument.

The thick green line is the estimated price where you can set Take-Profit (TP) or manually close positions, as further growth above this level is unlikely.

The thin red line is the entry price at which you can sell the trading instrument.

The thick red line is the price where you can set Take-Profit (TP) or manually close positions, as further decline below this level is unlikely.

MACD line: it is important to be guided by overbought and oversold areas when entering the market

Important: Novice traders in the forex market need to be very careful when making decisions to enter the market. It is best to stay out of the market before important fundamental reports are released to avoid getting caught in sharp price fluctuations. If you decide to trade during news releases, always place stop orders to minimize losses. Without setting stop orders, you can quickly lose your entire deposit, especially if you don't use money management and trade in large volumes.

And remember, for successful trading, it is necessary to have a clear trading plan, similar to the one I presented above. Spontaneously making trading decisions based on the current market situation is inherently a losing strategy for an intraday trader.Pentru mai multe detalii, va invitam sa vizitati stirea originala.

Forex forecast 07/24/2024: EUR/USD, USD/CAD, GBP/USD and Gold from Sebastian Seliga

We introduce you to the daily updated section of Forex analytics where you will find reviews from forex experts, up-to-date monitoring of financial information as well as online forecasts of exchange rates of the US dollar, euro, ruble, bitcoin, and other currencies for today, tomorrow and this trading week.

00:00 INTRO
00:15 Totay’s key events: Building Permits, S&P Global Services PMI, BoC Interest Rate Decision, New Home Sales, Crude Oil Inventories
03:23 EUR/USD
04:29 USD/CAD
07:47 GBP/USD
09:02 GOLD

www.instaforex.com - reliable Forex broker since 2007

Read Forex analysis on
https://www.instaforex.com/forex_analysis />
InstaForex course for beginners:
https://www.instaforex.com/distance_training_program />
More Forex Forecast:
https://www.instaforex.com/forex_analytics />
Open trading account:
https://www.instaforex.com/fast_open_live_account />
#instaforex #analysis #sebastianseliga Pentru mai multe detalii, va invitam sa vizitati stirea originala.

Forecast for AUD/USD on July 24, 2024

#

AUD/USD

The Australian dollar consolidated below the MACD line on the day chart and has almost settled below the target level of 0.6627. Falling commodity prices are pushing commodity currencies down, but after successfully breaking through the consolidation range of 0.6627/90, the price has entered a new range of 0.6578–0.6627.

analytics66a06b9164a34.jpg

Here, the price may wait for the Federal Reserve meeting (on July 31) and then move towards 0.6444 (the low of February 13). It is possible that the price might retest the MACD line from below (0.6647—the peak of April 9), which overall also aligns with a wait-and-see mode.

analytics66a06b83b83e2.jpg

On the 4-hour chart, Marlin rose throughout yesterday, which may signal a potential upcoming correction. Overall, since yesterday, the Australian dollar has been on track for a medium-term decline, roughly to the level of 0.6171—the low of October 2022.

The material has been provided by InstaForex Company - www.instaforex.com #