
Bitcoin has made a two and half month move higher from $3,000$ to $4,250 where it tested important weekly resistance levels and got rejected. Medium- and long-term trend remain bearish.
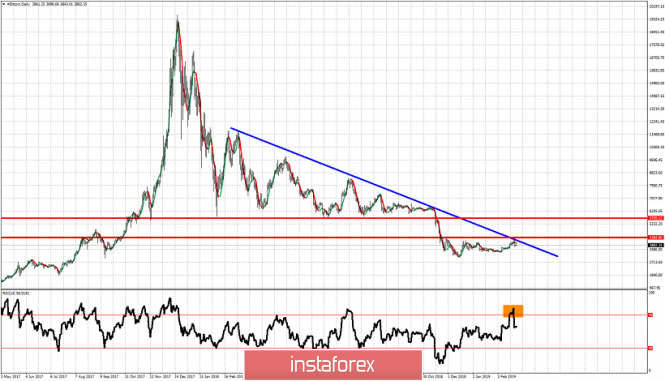
Blue line - major trend line resistance
Red lines - horizontal resistance levels
Orange rectangle - overbought RSI
With the RSI at overbought levels and turning lower, price getting rejected at both the blue downward sloping trend line and at the red horizontal resistance level, things do not look bullish for Bitcoin. Price remains below key resistance level of $4,400. A weekly close above this level will confirm medium-term trend change to bullish. Until then trend remains bearish. Short-term support is found at $3,650 and as long as price is above this level, bulls continue to hope for another challenge of the blue trend line resistance. Breaking above $4,400 will open the way for a move towards the next horizontal major resistance at $5,750. Until this happens, longer-term trend remains bearish and Bitcoin is vulnerable to a move below $3,000.
The material has been provided by InstaForex Company - www.instaforex.com


 Download NOW!
No comments:
Post a Comment