Showing posts with label www.instaforex.com. Show all posts

Dollar will remain strong despite the size of the US national debt

According to a number of experts, the dollar will continue to remain strong, even though it may shortly give up a part of the euro position.

EqCdFbV3QWW7DVF_ayX2xQ1KjscAsj2kr-3nZfmi

Since March 1, a ban on government loans comes into force in the United States. The so-called "public debt ceiling" was suspended last February as part of an agreement on the budget reached between Republicans and Democrats in Congress.

It is known that over the past year, the US Treasury took the record amount in the market since 2009 with $ 1.22 trillion and the country's total national debt exceeded $ 22 trillion. When the US Treasury actively attracts loans, dollar liquidity is withdrawn from the market. This creates a demand for the greenback from the large banks, which supports its rate. However, the situation may change in March, since the restriction on raising funds can deprive the dollar of this support.

It is assumed that the factor of raising the limit of US government debt for some time may weaken the position of the dollar against the euro by up to the level of 1.15.

At the same time, such fundamental factors and the difference in interest rates in the United States and Europe will continue to play against the euro while maintaining the current imbalance in the foreseeable future with risks sagging against the dollar below $1.12.

The material has been provided by InstaForex Company - www.instaforex.com

GBP / USD plan for the US session on March 1. The pound continues a slow downward correction

To open long positions on the GBP / USD pair, you need:

The data released in the first half of the day on the UK economy, particularly the PMI index for the manufacturing sector, did not support the pound as they coincided with economists' forecasts. The technical picture in the pair remained unchanged. It is best to return to long positions after fixing above the resistance of 1.3276, which can lead to the termination of stop orders of sellers and a sharper upward movement to the area of maximum at 1.3346, where I recommend taking profits. In case of further downward correction, long positions can be viewed at the false breakdown from the support of 1.3204 or at the rebound from the low of 1.3144.

To open short positions on the GBP / USD pair, you need:

Bears are slowly but surely striving for the support level of 1.3204 and as long as the trade is conducted below this range, the pressure on the pair will continue. However, in case the pound rises in the second half of the day, only an unsuccessful consolidation above the resistance of 1.3276 will be a signal to open short positions. Otherwise, selling the GBP/USD pair is best for a rebound from the maximum of 1.3346. The main goal is at least to the level of 1.3144, where I recommend fixing the profit.

More in the video forecast for March 1

Indicator signals:

Moving averages

Trade is conducted above 30- and 50-medium-moving, which indicates a bearish market correction.

Bollinger bands

Bollinger Bands indicator volatility is very low, which does not give signals on market entry.

tUhUBG0rMrvRxQ8JzQ1haCc6-3IEfGjnOWgaLtOT

Description of indicators

MA (moving average) 50 days - yellow

MA (moving average) 30 days - green

MACD: fast EMA 12, slow EMA 26, SMA 9

Bollinger Bands 20

The material has been provided by InstaForex Company - www.instaforex.com

EUR / USD plan for the US session on March 1. Eurozone Inflation based on the Forecast

To open long positions on EUR / USD pair, you need:

From a technical point of view, the EUR/USD pair has not changed. The data released in the first half of the day coincided with the expectations of economists, which kept the euro from a larger sale. Buyers still need to return to the resistance level of 1.1383 and fixing above which will be a signal to buy in order to update the weekly maximum of 1.1417, where I recommend taking profits. In the case of good statistics on the American economy, the results are scheduled to be released in the second half of the day. It is best to consider new long positions in EUR/USD pair after an update of the minimum at 1.1348 or to rebound from the support of 1.1317.

To open short positions on EUR / USD pair, you need:

As long as trading continues below the 1.1383 border, the pressure on EUR / USD will continue. The formation of a false breakdown on the said level in the second half of the day will be a direct signal to sell the euro to reduce to a minimum of 1.1348 and update the area of support at 1.1317, where I recommend fixing profits. Under the scenario of a re-growth of the euro above the resistance of 1.1383, it is best to consider new short positions for a rebound from the maximum of 1.1417 and 1.1459.

More in the video forecast for March 1

Indicator signals:

Moving averages

Trade remains in the region of 30- and 50-moving averages, which indicates the lateral nature of the market.

Bollinger bands

Bollinger Bands indicator volatility is very low, which does not give signals on market entry.

LbnT7HvCijrn1OVAWzR5jx_n9Xlc-1M7rdsee0LK

Description of indicators

MA (moving average) 50 days - yellow

MA (moving average) 30 days - green

MACD: fast EMA 12, slow EMA 26, SMA 9

Bollinger Bands 20

The material has been provided by InstaForex Company - www.instaforex.com

Intraday technical levels and trading recommendations for EUR/USD for March 1, 2019

analytics5c79310c37745.png

On November 13, the EUR/USD demonstrated recent bullish recovery around 1.1220-1.1250 where the current bullish movement above the depicted short-term bullish channel (In BLUE) was initiated.

Bullish fixation above 1.1430 was needed to enhance further bullish movement towards 1.1520. However, the market has been demonstrating obvious bearish rejection around 1.1430 few times so far.

The EUR/USD pair has lost its bullish momentum since January 31 when a bearish engulfing candlestick was demonstrated around 1.1514 where another descending high was established then.

This allowed the current bearish movement to occur towards 1.1300-1.1270 where the lower limit of the depicted DAILY channel came to meet the pair.

Since February 20, the EUR/USD pair has been demonstrating weak bullish recovery with sideway consolidations around the depicted price zone (1.1300-1.1270).

This week, significant bullish recovery has emerged on Tuesday. However, yesterday the pair has failed to fixate above 1.1400 with early signs of bearish rejection on the H4 chart.

This may indicate a high probability of a bearish reversal ONLY IF bearish breakdown below 1.1360 is achieved on H4 chart.

Please note that a bearish flag pattern may become confirmed if bearish persistence below 1.1250 is achieved on the daily basis. Pattern target is projected towards 1.1000.

Trade Recommendations:

A valid SELL entry can be offered around the price level of 1.1390. S/L to be located above 1.1425. T/P levels to be located around 1.1320 and 1.1240.

The material has been provided by InstaForex Company - www.instaforex.com

Intraday technical levels and trading recommendations for GBP/USD for March 1, 2019

analytics5c792beccf514.png

On December 12, the previously-dominating bearish momentum came to an end when the GBP/USD pair visited the price levels of 1.2500 where the backside of the broken daily uptrend was located.

Since then, the current bullish swing has been taking place until January 28 when the GBP/USD pair was almost approaching the supply level of 1.3240 where the recent bearish pullback was initiated.

Shortly after, the GBP/USD pair lost its bullish persistence above 1.3155. Hence, the short-term scenario turned bearish towards 1.2920 (38.2% Fibonacci) then 1.2820-1.2800 (50% Fibonacci level) within the depicted H4 bearish channel.

On February 15, significant bullish recovery was demonstrated around 1.2800-1.2820 (Fibonacci 50% level) resulting in a Bullish Engulfing daily candlestick.

This initiated the current bullish breakout above the depicted H4 bearish channel. Quick bullish movement was demonstrated towards 1.3155, 1.3240 and 1.3300.

Early signs of bearish reversal/retracement were demonstrated around the price level of 1.3317. Bearish pullback was expected to extend down towards 1.3240 and 1.3200 where price action should be watched cautiously for bullish positions.

Bullish persistence above the newly-established depicted demand-zone (1.3240-1.3190) is mandatory to allow further bullish advancement.

Any bearish breakdown below 1.3190 invalidates the short-term bullish scenario allowing a quick bearish movement to occur towards 1.3150 (lower limit of the demand zone) and 1.3060 where the recent bullish breakout was initiated.

Trade Recommendations:

Conservative traders should wait for bearish pullback towards 1.3190 for a valid low-risk BUY entry. S/L to be located below 1.3150. T/P levels to be located around 1.3240 and 1.3317 initially.

The material has been provided by InstaForex Company - www.instaforex.com

USD / JPY: Yen conceded at 112th figure

Today, the dollar/yen currency pair updated its annual maximum, closely approaching the boundaries of the 112th figure. Strengthening of the US currency against the backdrop of reducing anti-risk sentiment in the market pushes the pair upward, while the yen still does not have its own arguments for growth.

The temporary strengthening of the Japanese currency was due to a surge of geopolitical tensions when the threat of a full-scale war between the two states possessing a nuclear arsenal arose. For several days, the situation "hung in the balance" amid mutual accusations which increased the likelihood of further escalation. In turn, this fact increased the demand for defensive assets. However, there are hints to resolve the conflict today. According to the Prime Minister of Pakistan about the Indian pilot captured by the Pakistani military, he will be released as soon as possible. Moreover, he said that Pakistan demonstrates a peaceful gesture in order to de-escalate the conflict situation.

iIp5RUelV7I9SRX44-KZP0J3kqUjet3dN6V3SEmK

In addition to the Indo-Pakistani conflict, traders were also worried about the failure of negotiations between Trump and the UN. Let me remind you that the negotiation process between the leaders of the United States and the DPRK was completed ahead of schedule since the Americans rejected the proposal of the North Korean side. But later it became known that the parties agreed to continue bilateral relations and the heads of state promised to hold a new meeting over time "in order to continue the productive discussion."

Thus, the geopolitical situation changed quite dramatically, literally within 24 hours. After which, a risk appetite appeared on the market and both the gold and yen began to lose value. Consequently, the dollar received support from data on the growth of the American economy. Although the GDP indicator showed an expected decrease, the rates of slowing down of this indicator were not so fast.

Therefore, the index rose to 2.6% instead of the 2.2% projected GDP growth in the fourth quarter of last year. In addition, the positive surprise of yesterday's released dynamics of the GDP price index as it came out a little better than expected to 1.8% instead of 1.7%. Although, the fact remains that the index stayed at the level of the third quarter. Also, traders drew attention to Chicago's PMI, which peaked from December 2017. The business activity index in Illinois jumped to 64.7 points in February in contrary to the forecast growth to 57.5. For comparison, last month this indicator went out at around 56.7. The structure of this indicator suggests that the components of new orders, production and employment rose to maximum levels.

It should be noted here that the dynamics of GDP remain negative since the decline in the indicator has been recorded for the third quarter in a row. However, the dollar bulls were able to "convince" the market, arguing that the prospects for the American economy are not as pessimistic as they say and this means that the Fed can resume monetary tightening in the second half of this year. In my opinion, these findings are too premature. Jerome Powell, who spoke in Congress, has acknowledged that the US economy is "in good shape," but there are other constraints that influence the regulator's determination such as the global economic dynamics, weak inflation, and wages. In other words, yesterday's data is unlikely to form the basis of a dollar rally. We are dealing only with a temporary correction.

Nevertheless, if we talk directly about the USD/JPY pair, the dollar will be the priority here since the yen focuses mainly on external fundamental factors. The de-escalation of the Indo-Pakistani conflict, as well as the continuation of the dialogue between the United States and the DPRK reduced anti-risk sentiment, resulted in a depreciation of the yen across the entire market. "Internal" fundamental factors only encourage the devaluation process.

Thus, there are rumors saying that the Bank of Japan may expand a stimulating program in the near future by increasing the purchase of government bonds are being actively circulated in the market. According to Kuroda, the regulator will resort to such measures, "if the economy and inflation lose momentum." It is worth recalling that the Japanese economy grew by 0.3% compared to the third quarter, failing to reach the forecasts of most analysts to 0.4%. Inflation in Japan is also growing at a rather weak pace and still far from the target level, given the CPI data of 0.8% with a baseline of 0.4%, Therefore, the likelihood of monetary policy easing by the Bank of Japan is really quite high.

w04klnaPUdvJ24jorZ_JzYBSQchEY4uc7VAe7MXG

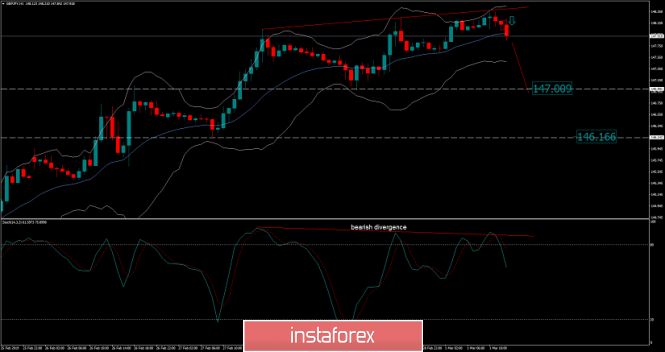
Summarizing what has been said, we can draw several conclusions. First, the dollar/yen pair has reasonably left the price range of 110-111, where most of February was located). Secondly, the pair has the potential for further growth.

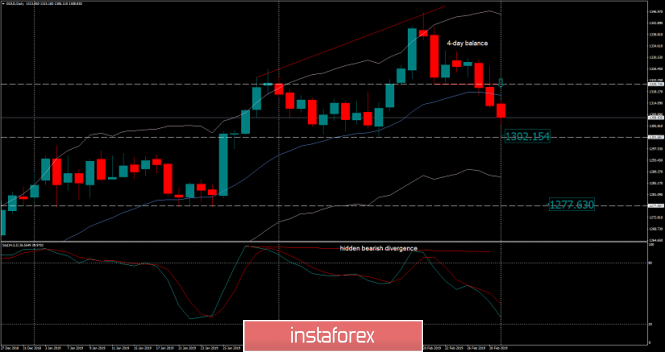
On the daily chart, the price is on the upper line of the Bollinger Bands indicator and these lines demonstrate the expanded channel. The Ichimoku indicator has formed one of its strongest signals with a bullish Parade of Lines. In addition, the pair is located above the Kumo cloud, which also indicates the northern direction of the price. Purchases can also be viewed from current levels, although, it is better to wait for the price to fix in the area of the 112th figure. It is worth noting that the next resistance level of 114.75 is quite high on the upper line of the Bollinger Bands indicator.

The material has been provided by InstaForex Company - www.instaforex.com

A break will benefit all

The growth rate of the US GDP has somewhat slowed down in Q4 but it was not as pronounced as the market had expected, which ultimately contributed to the strengthening of the dollar.

The first data release points to a 2.6% annual GDP growth, which is worse than 3.4% in the 3rd quarter and 4.2% in Q2, but better than the predicted 2.3%. For the whole of 2018, the growth was 2.9%, which is quite consistent with a strong labor market. The ISM index assumes even higher GDP growth than preliminary data. Thus, a failure in Q1 despite weak retail sales data and shutdown is unlikely to occur.

-xe-KVQmkDOlfZZFqj7bWcVnrvUTHMVpWS6RHstv

Nevertheless, the slowdown of the US economy in 2019 is inevitable, considering the tightening of financial conditions and weakening incentives have a lagging effect, and tax reform could not have the effect that was calculated. The yield curve still indicates the likelihood of a recession in the next 9-12 months, but in order to push the development of events under a negative scenario, some kind of driver is required. The growth of stock markets as a reaction to the Fed's changing policy indicates that the bubble has not yet fully formed and some potential for growth remains. The Fed's plans to find an equilibrium level of balance above the pre-crisis one and a pause in interest rates also indicate an intention to prevent excessive tightening of financial conditions.

A lot of questions has caused the exhaustion of the national debt ceiling and the growth of the budget deficit. But so far, there is no action and the dollar will remain stable. Trade negotiations with China are slow, but some of the growing US deficit will still be closed at the Chinese expense. Soon after, Europe's turn will come.

Today is quite a busy day for the dollar. Data on personal consumption in December, PMI Markit, as well as, ISM indices in the manufacturing sector and consumer confidence index from the University of Michigan will be published. In general, the expectations are moderately positive and taking into account it is Friday, we can expect that the dollar will slightly improve its position, primarily against the yen, by the close of the week.

EUR / USD pair

The Preliminary data on consumer prices in Germany in February can be considered positive. Fears of a possible slowdown in inflation rates did not materialize. Today, data on inflation in the Eurozone as a whole will be published with a positive outlook. The output of the data is not worse than expected which can support the euro.

The decline in the EUR/USD pair still looks corrective and may end in the area of 1.1340/50. There is a probable resumption of growth with the target of 1.1418 and then to 1.1430.

GBP / USD pair

According to Gfk, Consumer confidence in the UK is low but at a stable level. The index slightly increased to -13p in February against -14p a month earlier, which turned out to be a surprise, as it was predicted to decline to -15p.

Au_meluX2nZU52XXZ7PqXDtoWme8Rd1_Zo9-WA02

The index is more positive than negative, despite the slowdown in economic growth and uncertainty on Brexit. There are no signs of a sharp fall, which was immediately observed after the referendum. At the same time, the mood regarding the general economic situation remains gloomy and consumers are afraid of a possible storm when faced with the first consequences of leaving the EU.

The development of the situation occurs according to the scenario of Brexit, wherein the usual characteristic for those cases when each side tries to avoid responsibility for the result as much as possible. A complex three-stage parliamentary voting plan was adopted with a high probability to be completed, either by extending the validity period of Article 50 for 2-3 months or by a new referendum. The parties are trying to get away from the scenario where the UK leaves the EU without any deal. For the pound, these throwings are rather positive, since they indicate a reluctance to increase tensions.

Today, the pound remains to be the favorite to be paired with the dollar. The support is at the level of 1.3211, however, the probability of decline to this support is low. More likely, there will be growth and an attempt to update the recent high of 1.3350.

The material has been provided by InstaForex Company - www.instaforex.com

Bitcoin analysis for March 01, 2019

Nothing has specially changed since my previous analysis. BTC did a fake breakout of support at the price of $3.680, which is a clear-cut sign of a trend reversal.

analytics5c7923d5857cb.png

We found a strong rejection of the support at $3.680 in combination with the bullish divergence on the Stochastic oscillator, which is an obvious sign of a trend reversal. Support is seen at the price of $3.634 and resistance is at $3.900.

Trading recommendation: We are bullish about BTC from 3.810 with targets at $3.900 and $4.060. Protective stop is placed at $3.630.

The material has been provided by InstaForex Company - www.instaforex.com

GBP/JPY analysis for March 01, 2019

GBP/JPY did the fake breakout of the resistance at 148.22, which resulted that sellers entered the market.

analytics5c791f01c2cad.png

According to the H1 time -frame, we found a hidden bearish divergence on the Stochastic oscillator, which did set the bearish tone today. There is also breakout of the 10h balance support at 148.00, which is another sign of the GBP weakness. Short-term support is seen at the price of 147.00 and 146.15. Key short-term resistance is set at 148.33.

Trading recommendation: We are short GBP from 147.90 and protective stop at 148.35. Downward targets are set at the price of 147.00 and 146.15.

The material has been provided by InstaForex Company - www.instaforex.com

Trading Plan 01/03/2019

The big picture: The market decides on the direction.

Although, news comes in different directions.

Positive: Prime Minister of Britain, Theresa May, agrees to postpone Brexit's term unless she receives a majority on the last ballot under an agreement with the EU scheduled for March 12. The deadline will be rescheduled.

The US GDP report showed a confident 2.6% increase in the fourth quarter.

Fed Chairman, Jerome Powell, confirmed that the Fed stops tightening monetary policy, at least for the time being.

However, the market did not come to a united opinion about the direction of the spring trend: The pound clearly seeks to grow against the dollar but at the same time, the yen is falling against the dollar. Meanwhile, the dollar/yen is up.

The euro must consolidate above 1.1425 to continue its growth.

We are ready to buy the euro at a breakthrough to 1.1425. Alternately, we can sell on a breakdown of 1.1315.

OEG5wWeQl7tRYivqFiih0NyPJ0QTru6v5J5Ii3bA

The material has been provided by InstaForex Company - www.instaforex.com

Analysis of Gold for March 01, 2019

Gold breached the 4-day balance support ($1.320.00) and on that way confirmed the direction.

analytics5c791ab8a332b.png

The current bearish tone on Gold came from the fake breakout of the resistance at $1.325.00 in the background together with the bearish divergence on the Stochastic oscillator. Most recently, there is the breakout of the 4-day balance and the bearish momentum is present. Key support levels are seen at $1.302.15 and at $1.277.65

Trading recommendation: We exited our yesterday's long position and we are bearish from $1.310.00 and targets at $1.302.15 and $1.277.65.

The material has been provided by InstaForex Company - www.instaforex.com

Trump "ruined" again

On Thursday, world markets were again in a state of bewilderment, more likely close to shock, and there were two reasons for this.

The first is an unexpected departure from Pyongyang where negotiations between US President Donald Trump and North Korean leader Kim Jong-un took place. According to the Trump, "sometimes you just need to leave." It seems that what he had in mind is the impossibility of an agreement on the nuclear program with North Korea without giving up his own interests.

The impulsive nature of the American leader has once again shown that he is not able to compromise. The North Koreans wanted all the sanctions lifted from their country as a result of the negotiations, however, Trump said that this was impossible. This news plunged the world markets into a near-shock state since if no agreement is reached between the United States and the DPRK, the risk of nuclear blackmail by the latter will hang over the States and cause a reason for them to be nervous.

The second reason for the growth of negative sentiment in the markets was the publication of weak US GDP data for the fourth quarter. Although some officials, such as Finance Minister Steven Mnuchin, reassured by saying that this happened only because of the long-term "shutdown" rather than weakening economic growth in the country. The markets did not believe this, which affected the negative dynamics of the US major stock indexes. In addition, the comment by the US Trade representative, Robert Lighthizer, at the talks between Washington and Beijing has reduced the likelihood of signing a new broad trade agreement in the near future and came across as negative.

It seems that such realities are indeed pointing out that not everything is so easy going on in the negotiation process, despite the optimistic statements of Trump and Mnuchin. Investors are no longer responding to this and are simply waiting for reports on the actual conclusion of an agreement and they will no longer be interested in the hype around this event and the real facts. This scenario is when you can expect really strong movements in the markets, including, of course, the currency. In the meantime, as we indicated earlier on more than one occasion, the overall lateral dynamics against the background of low volatility will prevail.

Forecast of the day:

The AUD/USD pair is trading above the level of 0.7085, still remaining in the range of 0.7060-0.7200. We consider it possible to buy the pair either during its decline from the level of 0.7060 or after its fall below the mark of 0.7085 or immediately from this level with a likely increase in price to 0.7200.

The GBP/USD pair has adjusted downward after a strong growth on the wave of a probable Brexit delay. If the price drops below 1.3240, it is likely to fall to 1.3190.

UMDsM3lJaK4vh0ggu6zlXFeZetitABTLeWSFILJ3

OSm1E8OTJRYJB4mwS_gsu78nXYywt3vDyZ02I0fo

The material has been provided by InstaForex Company - www.instaforex.com

GDP: The US economy is in better shape than expected

The euro fell sharply against the US dollar after the publication of a weak report on inflation in Germany, as well as data on US GDP growth, which were much better than economists' forecasts, which returned hope to investors for a faster return to the growth rates of the American economy above 3.0%.

According to the report of the Federal Bureau of Statistics of Germany, inflation in Germany increased in February, but the data fully coincided with the forecasts of experts.

The increase was mainly due to upward pressure from energy and food prices.

Thus, the preliminary CPI in Germany in February 2019 increased by 0.5% compared with the previous month and 1.6% compared with the same period of the previous year. Economists had expected the index to grow by 0.5% in February compared with the previous month and by 1.5% compared with the same period of the previous year.

As noted above, the increase was due to the rise in prices for energy carriers, the prices of which rose in February by 2.9% compared with the same period of the previous year. Food prices increased by 1.5% compared with the same period last year.

As for the index harmonized by EU standards, in February, it increased by 0.5% compared with the previous month and by 1.7% compared with the same period of the previous year. Economists had expected the index to grow by 0.6%.

All traders' attention in the afternoon was focused on the report on US GDP growth in the 4th quarter of 2018, which caused particular concern among investors. Despite the fact that the

year ended on a weak note, and GDP growth slowed, the data were much better than predicted.

According to the first estimate of the US Department of Commerce, the gross domestic product of the United States in the 4th quarter of 2018 increased by 2.6% per annum. Economists had forecast GDP growth of 2.2% in the 4th quarter. Let me remind you that back in the 3rd quarter, the US economy grew by 3.4%, and in the 2nd quarter by 4.2%.

c0AHxcEIz0nK9sRRnDsIJruXXekpVt_akQfsVNQF

The decline is associated with a slowdown in economic activity, as well as a decrease in consumer spending.

The number of Americans who first applied for unemployment benefits rose last week, but the change in weekly indicators poses no threat to the market as a whole. According to data from the US Department of Labor, the number of initial claims for unemployment benefits increased by 8,000 over the week from February 17 to 23 and amounted to 225,000. Economists had expected that the number of initial claims would be 220,000.

A speech in the second half of the day by the representative of the Fed Richard Clarida helped the US dollar to maintain an upward momentum against a number of world currencies.

Clarida said the US economy will continue to grow steadily in 2019, albeit at a slightly slower pace. Inflation is at the lower end of the range corresponding to the target level of 2%, as well as interest rates, which are in the range that corresponds to the assessment of the neutral level. As for the Fed's balance sheet, then, in the opinion of the Fed representative, its final size will be determined by the demand for currency and reserves.

The material has been provided by InstaForex Company - www.instaforex.com

GBP / USD. March 1. The trading system. "Regression Channels". New resignation in the British Parliament

4-hour timeframe

n8eQtoPaIOktViNe0jJwCrj4EQ8WAc5CuondD-5V

Technical details:

The senior linear regression channel: direction - up.

The younger linear regression channel: direction - up.

Moving average (20; smoothed) - up.

CCI: 43.5187

The GBP / USD currency pair has begun a weak downward correction to the moving average. It seems that at this stage, the enthusiasm of traders regarding the possible transfer of Brexit to a later date has dried up. Meanwhile, the Minister of Agriculture of Great Britain, George Eustice, resigned on the grounds of a desire to "be free during the political debates of the near future." Also, Eustice said that postponing Brexit to a later date would allow Brussels to dictate terms that would "humiliate the UK". Thus, this is the sixth resignation of a high-ranking official in the British Government due to disagreement with politics or certain decisions of Theresa May. The situation thus remains uneasy in all aspects, therefore the growth of the British pound sterling in recent days still looks unreasonable and surprising. Suppose it was acceleration before the new fall, then now is the time for this fall to begin. From a technical point of view, it will be possible to talk about the formation of a downtrend only after overcoming the moving average line. Up to this point, it is still recommended to trade with the trend. Today in the UK, the publication of an index of business activity in the manufacturing sector is scheduled. The value of this indicator in the past month went under level 50, which is a negative trend.

Nearest support levels:

S1 - 1.3184

S2 - 1.3062

S3 - 1.2939

Nearest resistance levels:

R1 - 1.3306

R2 - 1.3428

R3 - 1.3550

Trading recommendations:

The pair GBP / USD started the correction. Thus, it is recommended to open buy orders in case of a Heikin Ashi indicator turning up with a target of 1.3306, which has already been worked out.

It is recommended to open the short positions in case the pair overcome the moving average. In this case, the trend in the instrument to change to downward, and the first goal will be the Murray level of "3/8" - 1.3062.

In addition to the technical picture should also take into account the fundamental data and the time of their release.

Explanations for illustrations:

The senior linear regression channel is the blue lines of the unidirectional movement.

The junior linear channel is the purple lines of the unidirectional movement.

CCI is the blue line in the indicator regression window.

The moving average (20; smoothed) is the blue line on the price chart.

Murray levels - multi-colored horizontal stripes.

Heikin Ashi is an indicator that colors bars in blue or purple.

The material has been provided by InstaForex Company - www.instaforex.com

EUR / USD. March 1. The trading system. "Regression Channels". The euro will be supported if inflation accelerates

4-hour timeframe

6O4Wd8GdWhA-US0Kgy82Irwr5Qosi4wQ_9AwQSp3

Technical details:

The senior linear regression channel: direction - down.

The junior linear regression channel: direction - down.

Moving average (20; smoothed) - sideways.

CCI: 29.0553

The currency pair EUR / USD on Friday, March 1, again corrected to the moving average line. All movements on the instrument are still of low volatility. Thus, it can be noted that in the instrument as a whole, nothing changes. On the last trading day of the working week, it is planned to publish preliminary values of inflation in the European Union for February and the unemployment rate. Unemployment is expected to be 7.9%, while the CPI will accelerate to 1.5%. We recall that, in principle, any value below the target 2% can be considered a weak indicator. However, if there is an unexpected stronger acceleration of inflation, this may support the euro currency. In America, data on changes in personal income and expenditures of the American population, as well as indexes of business activity in the manufacturing sector Markit and ISM will be published today. Thus, the big news today will be, above all, to the actual values on the line with the forecasts, then we can expect to gain volatility. Also, the inflation rate is important from the point of view of understanding the general economic situation in the European Union. Recently, more and more talk that the EU is slipping into recession, and the uncertainty with Brexit only puts more pressure on this situation. In part, macroeconomic indicators confirm these concerns.

Nearest support levels:

S1 - 1.1353

S2 - 1.1292

S3 - 1.1230

Nearest resistance levels:

R1 - 1,1414

R2 - 1.1475

R3 - 1.1536

Trading recommendations:

The EUR / USD currency pair has begun a new round of correction, as indicated by the Heikin Ashi indicator. Thus, it will be possible to open new long positions after turning this indicator to the top with the target of 1.1414, which has already been tested.

Sell positions can be considered after the price is fixed below moving. In this case, the trend in the instrument will change to downward, and the first goal will be the level of 1.1292.

In addition to the technical picture should also take into account the fundamental data and the time of their release.

Explanations for illustrations:

The senior linear regression channel is the blue lines of the unidirectional movement.

The younger linear regression channel is the purple lines of the unidirectional movement.

CCI - blue line in the indicator window.

The moving average (20; smoothed) is the blue line on the price chart.

Murray levels - multi-colored horizontal stripes.

Heikin Ashi is an indicator that colors bars in blue or purple.

The material has been provided by InstaForex Company - www.instaforex.com

Analysis of EUR / USD Divergences for March 1. Two bearish divergences sent the euro down

4h

FuNYxUM-FSNUhrLbrWAKJKiz3D8fVH7H691zysxn

The EUR / USD pair on the 4-hour chart after the formation of a new bearish divergence at the indicator CCI performed a reversal in favor of the US dollar and a return to the correctional level of 23.6% - 1.1358. The end of quotes from this Fibo level will allow traders to count on a turn in favor of the EU currency and the resumption of growth in the direction of the correction level of 38.2% - 1.1446. Fixing the pair below the Fibo level of 23.6% will increase the likelihood of a further fall towards the level of 1.1269.

The Fibo grid is built on extremes from September 24, 2018, and November 12, 2018.

Daily

m9Rgu90Rn6w3RXU9im8qH3MhNRFp-6iG7MYM92Rt

On a 24-hour chart, a bearish divergence allows us to expect a reversal in favor of the American currency and a slight drop in the direction of the correctional level of 127.2% - 1.1285. However, the passage of the last divergence peak will work in favor of the euro currency and continued growth in the direction of the correction level of 100.0% - 1.1553. Fixing quotes below the Fibo level of 127.2% will increase the probability of a further fall in the direction of the next correction level of 161.8% - 1.0941.

The Fibo grid is built on extremums from November 7, 2017, and February 16, 2018.

Recommendations to traders:

Purchases of the EUR / USD pair can be carried out with the target of 1.1446 if the pair disconnects from the level of 1.1358, and the Stop Loss order is below the level of 23.6%, but be careful, as there is a bearish divergence on the 24-hour chart.

Sales of the EUR / USD pair can be made with the target of 1.1269, and with a Stop Loss order above the level of 1.1358, if the pair closes below the Fibo level of 23.6%.

The material has been provided by InstaForex Company - www.instaforex.com

Analysis of GBP / USD Divergences for March 1. The level of 1.3300 was an insurmountable obstacle.

4h

z1wjb1wzyi4RpRMehEvh9yCRW3c1Lv9ca7FlpdLK

The GBP / USD pair on the 4-hour chart completed growth to the correction level of 100.0% - 1.3300 and a turn around it in favor of the American dollar. As a result, on March 1, the fall process can be continued in the direction of the Fibo level of 76.4% - 1.3090. There is no indicator of the emerging divergences today. Fixing a pair of quotes above the correction level of 100.0% can be interpreted as a reversal in favor of the British currency and we expect a resumption of growth in the direction of the correctional level of 127.2% - 1.3530.

The Fibo grid is built on extremes from September 20, 2018, and January 3, 2019.

1h

Uy7eMo8rupJzmWCZRA36F5RsUZLaIpINwbZvMx8j

On the hourly chart, after the pair rebounds from the Fibo level of 127.2% - 1.337 and the formation of a bearish divergence at the MACD indicator. The process of falling continues in the direction of the correction level of 100.0% - 1.3217. Rebounding the pair from this level will allow us to expect a reversal in favor of the British currency and the resumption of growth in the direction of the correction level of 127.2%. Closing the pair below the 100.0% level will work in favor of continuing the fall towards the next Fibo level of 76.4% - 1.3111.

The Fibo grid is built on extremes from January 25, 2019, and February 14, 2019.

Recommendations to traders:

Purchases of the GBP / USD pair can be made with the target of 1.3337 and a Stop Loss order under the level of 100.0% if the pair bounces off the level of 1.3217 (hourly chart).

Sales of the GBP / USD pair can be carried out now with the target of 1.3217 and a Stop Loss order above the level of 127.2% since the pair has completed the rebound from the level of 1.3337 (hourly chart).

The material has been provided by InstaForex Company - www.instaforex.com

Simplified wave analysis. Overview of GOLD for March 1

Large TF:

The main trend of gold since last summer is given by the rising wave, which is still unfinished. The lower boundary of the preliminary completion zone is around $ 1,400 / troy ounce.

Small TF:

As part of the rising wave from the beginning of the year, a counter correction is formed, having the form of an "expanding triangle". The bearish patch of February 20 completed the design. The estimated completion zone has been reached, but the reversal signals on the chart are not yet observed.

BphUhT-wMJNiU9uilzRxJ900H3O6jOKYz9AENtCs

Forecast and recommendations:

The correction period is nearing completion. This week, traders need to be ready for the start of a new upward phase of the movement. It is recommended to track reversal signals in order to search for the instrument purchase signals.

Resistance zones:

- 1375.0 / 1380.0

Support areas:

- 1310.0 / 1305.0

Explanatory notes for the figures: The simplified wave analysis uses waves consisting of 3 parts (A – B – C). On each of the considered scales of the graph, the last, incomplete wave is analyzed. Zones show calculated areas with the highest probability of reversal. The arrows indicate the wave marking by the method used by the author. The solid background shows the formed structure, the dotted - the expected movement.

Note: The wave algorithm does not take into account the duration of tool movements over time. To conduct a trade transaction, you need confirmation signals from the trading systems you use!

The material has been provided by InstaForex Company - www.instaforex.com

Simplified wave analysis. Overview of EUR / JPY for March 1

Large TF:

After the completed bearish trend with the beginning of the current year, the direction of the short-term trend of the cross is set by the upward wave. In its structure in February, the correctional part (B) was completed.

Small TF:

The price rise that began on February 8 in the larger model gave rise to the final phase of the movement (C). Before further appreciation of the rate from current price values, an intermediate pullback is possible.

ZDE2Za7vui0Tn6JENrmKSmh8wJHchkoaEnfxPjW-

Forecast and recommendations:

A consolidation period is expected on the cross chart this week. Reducing further settlement support is unlikely. It is recommended to use price pullbacks to strengthen long positions in the market of the pair.

Resistance zones:

- 128.10 / 128.60

Support areas:

- 126.30 / 125.80

Explanatory notes for the figures: The simplified wave analysis uses waves consisting of 3 parts (A – B – C). On each of the considered scales of the graph, the last, incomplete wave is analyzed. Zones show calculated areas with the highest probability of reversal. The arrows indicate the wave marking by the method used by the author. The solid background shows the formed structure, the dotted - the expected movement.

Note: The wave algorithm does not take into account the duration of tool movements over time. To conduct a trade transaction, you need confirmation signals from the trading systems you use!

The material has been provided by InstaForex Company - www.instaforex.com

Simplified wave analysis. Overview of GBP / USD for March 1

Large TF:

The last unfinished wave of the pound is bearish, starting from last April. In recent months, an upward correction section has been formed within its framework.

Small TF:

The short-term vector to the movement of the pair is set by an unfinished bull wave dated December 12. At the time of analysis, the price reached the zone of potential large-scale reversal. Reversal signals are not yet formed.

D8Sz_-1VG3JovD8JErhZsAMN9mkXhgjc_fllHftZ

Forecast and recommendations:

The potential of the current rise of the pound is limited by strong resistance. This week, we should expect a turnaround and the beginning of depreciation, with the overall flat nature of price fluctuations. During this period, the best tactic for traders will remain out of the market.

Resistance zones:

- 1.3320 / 1.3370

Support areas:

- 1.2990 / 1.2940

Explanatory notes for the figures: The simplified wave analysis uses waves consisting of 3 parts (A – B – C). On each of the considered scales of the graph, the last, incomplete wave is analyzed. Zones show calculated areas with the highest probability of reversal. The arrows indicate the wave marking by the method used by the author. The solid background shows the formed structure, the dotted - the expected movement.

Note: The wave algorithm does not take into account the duration of tool movements over time. To conduct a trade transaction, you need confirmation signals from the trading systems you use!

The material has been provided by InstaForex Company - www.instaforex.com