
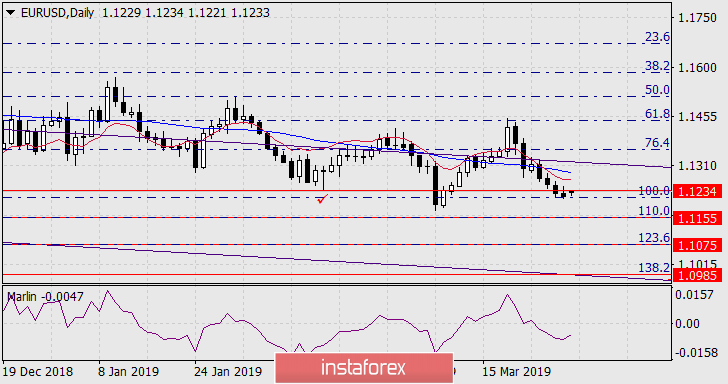
EUR/USD
Last Friday, the euro tried to get above the control technical level of 1.1234, but the bears stopped these attempts, the day closed with a black candle and thus the price consolidated below this level, which created another additional factor for the euro's further decline to Fibonacci lines: 1.1155 - 110.0%, 1.1075 - 123.6%, 1.0985 - 138.2%. The basic branch of the Fibonacci grid is taken at extremes on September 24 and November 12, 2018.

On the four-hour chart, the signal line of the Marlin oscillator enters the growth zone, which warns about the possibility of a false exit of the price over the control level of 1.1234, but in general, this does not change the situation.


 Download NOW!
No comments:
Post a Comment