

EUR/USD
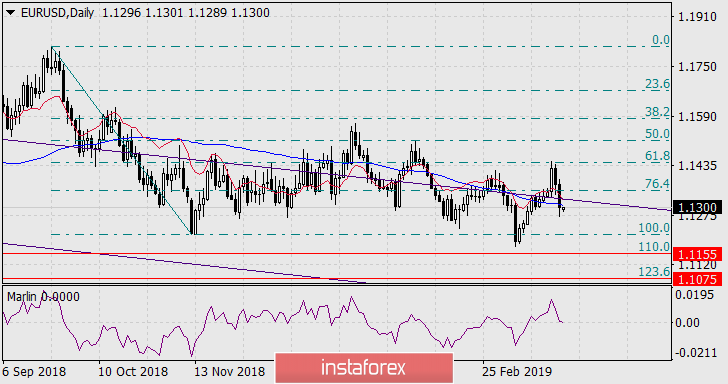
On Friday, the euro fell by 72 points and overcame key technical support - the MACD line on a daily and H4 scale. Marlin oscillators of both charts show a decreasing trend. The path to further lowering the euro is open.
The first significant goal is to support the embedded line in the falling blue price channel of the weekly chart - 1.0975, but there are two more support areas on the way to this target - Fibonacci reaction levels from the movement on September 24 - November 12 last year - 110.0% and 123, 6%, which correspond to price levels of 1.1155 and 1.1075.
So, we are waiting for the price at the nearest price level of 1.1155.


 Download NOW!
No comments:
Post a Comment