
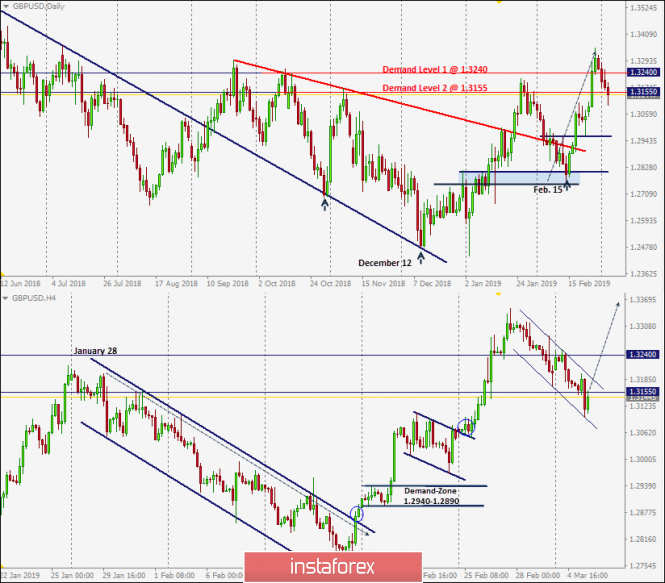
On December 12, the previously-dominating bearish momentum came to an end when the GBP/USD pair visited the price levels of 1.2500 where the backside of the broken daily uptrend was located.
Since then, the current bullish swing has been taking place until January 28 when the GBP/USD pair lost its bullish persistence above 1.3155. Hence, the short-term scenario turned bearish towards 1.2920 then 1.2820-1.2800 within the depicted H4 bearish channel.
On February 15, significant bullish recovery was demonstrated around 1.2800-1.2820 resulting in the current bullish breakout above the depicted H4 bearish channel. Quick bullish movement was demonstrated towards 1.3155, 1.3240 and 1.3300.
Early signs of bearish reversal/retracement were demonstrated around the price level of 1.3317. Bearish pullback was expected to extend down towards 1.3150 and 1.3100 where the lower limit of the current Flag/channel pattern is located.
Bullish persistence above the newly-established depicted demand-level (1.3150) is mandatory to allow further bullish advancement towards 1.3240 initially.
On the other hand, any bearish breakdown below 1.3150 then 1.3100 invalidates the short-term bullish scenario allowing a quick bearish movement to occur towards 1.3060 where the recent bullish breakout was initiated.
The material has been provided by InstaForex Company - www.instaforex.com


 Download NOW!
No comments:
Post a Comment