
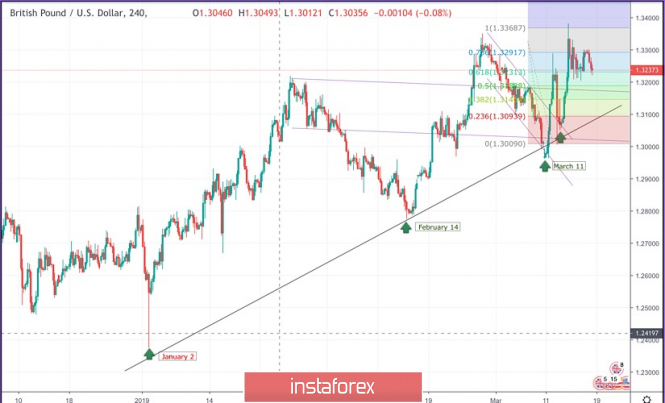
On January 2nd, the market initiated the depicted uptrend line around 1.2380.
This uptrend line managed to push price towards 1.3200 before the GBP/USD pair came to meet the uptrend again around 1.2775 on February 14.
Another bullish wave was demonstrated towards 1.3350 before the bearish pullback brought the pair towards the uptrend again on March 11.
A weekly gap pushed the pair slightly below the trend line (almost reaching 1.2960) . However, significant bullish recovery was demonstrated rendering the mentioned bearish gap as a false bearish breakout.
Moreover, a short-term bearish channel was broken to the upside following the mentioned bullish recovery on March 11 rendering the short-term outlook as bullish.
As expected, bullish persistence above 1.3060 allowed the GBPUSD pair to pursue the bullish momentum towards 1.3130, 1.3200 then 1.3300 where significant bearish rejection is being demonstrated
For the current bullish outlook to remain valid, bullish persistence above 1.3230 ( 61.8% Fibonacci expansion level ) is mandatory. Otherwise, the current bullish scenario would be invalidated.
Moreover, bullish persistence above 1.3290 (78.6% Fibonacci expansion level) and 1.3368 ( 100% Fibonacci expansion level) is needed to pursue towards 1.3550-1.3580 (Bullish flag projection target).
On the other hand , bearish breakout below 1.3180 (50% Fibonacci Exp. level) invalidates this bullish setup rendering the short-term outlook bearish towards 1.3070-1.3050 where the depicted uptrend line comes to meet the GBPUSD pair to be tested once more.
The material has been provided by InstaForex Company - www.instaforex.com


 Download NOW!
No comments:
Post a Comment