
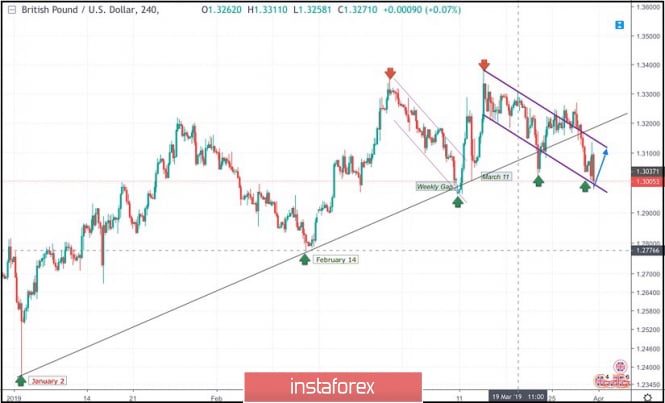
On January 2nd, the market initiated the depicted uptrend line around 1.2380.
This uptrend line managed to push price towards 1.3200 before the GBP/USD pair came to meet the uptrend again around 1.2775 on February 14.
Another bullish wave was demonstrated towards 1.3350 before the bearish pullback brought the pair towards the uptrend again on March 11.
A weekly bearish gap pushed the pair slightly below the trend line (almost reaching 1.2960) before the bullish breakout above short-term bearish channel was achieved on March 11.
Bullish persistence above 1.3060 allowed the GBPUSD pair to pursue the bullish momentum towards 1.3130, 1.3200 then 1.3360 where the recent bearish pullback was initiated.
Bullish persistence above 1.3250 was needed for confirmation of a bullish Flag pattern. However, significant bearish pressure was demonstrated below 1.3250 demonstrating a false bullish breakout above 1.3200 (the upper limit of the depicted bearish channel).
Hence, the short term outlook turned to become bearish towards 1.3150 - 1.3120 where the depicted uptrend line failed to provide any immediate bullish support.
Currently, the price levels of 1.3020-1.3000 (the lower limit of the depicted movement channel) is being challenged where bullish rejection is expected to be found.
Next bullish target is located around 1.3140 where the upper limit of the depicted movement channel is located.
Trade Recommendations:
Intraday traders can have a valid BUY entry around the lower limit of the movement channel (1.3000-1.3020).
SL to be located below 1.2970. TP levels to be located around 1.3100 and 1.3140
The material has been provided by InstaForex Company - www.instaforex.com


 Download NOW!
No comments:
Post a Comment