
Gold price has started a pull back from the $1,310 resistance area towards the first important short-term support of $1,290. The bullish short-term channel has been broken. This fact increases the importance of the $1,290 support level. A bigger bounce towards $1,320 is viable only while we trade above $1,292.
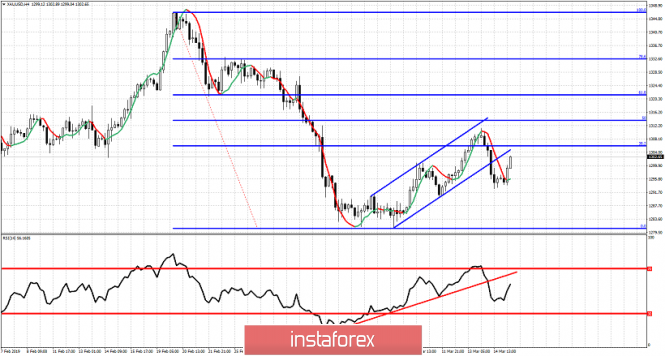
Red line - RSI support (broken)
Earlier, considering the 38% Fibonacci retracement and with the RSI at overbought levels, we spoke about a pull back at least towards the support level of $1,300. However, price movement exceeded our expectations and even broke below this support. This is a bearish sign. Resistance is now the lower channel boundary as we could see a back test and bounce from $1,305. Major short-term support is at yesterday's low of $1,292. A breakout below this level opens a way for a move towards $1,280 and maybe lower. As long as we stay above $1,292, we can see another leg higher towards $1,321 and the 61.8% Fibonacci retracement. I prefer the trend to turn bearish once $1,292 fails to hold. Until then, we should be cautious as there are still chances of one more new higher high.
The material has been provided by InstaForex Company - www.instaforex.com


 Download NOW!
No comments:
Post a Comment