Thursday, March 7, 2019
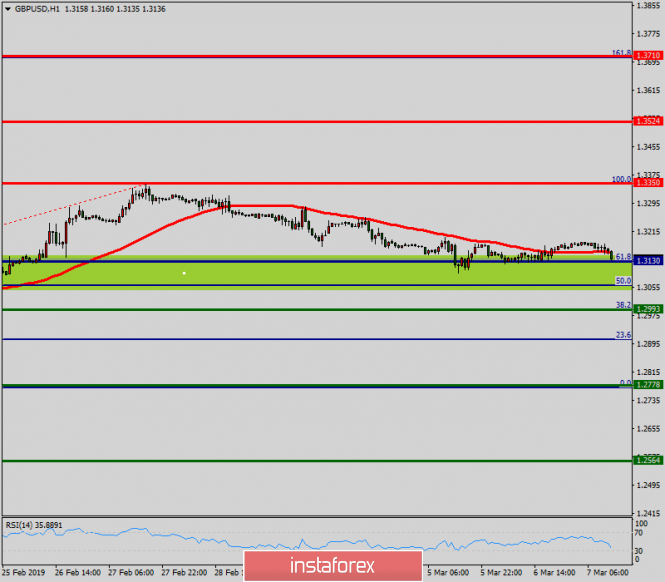
Technical analysis of GBP/USD for March 07, 2019
Subscribe to:
Post Comments (Atom)

 ★ ★ ★ ★ ★
📈 StairSteps is an EA which can trade consolidation zones using a stairstep breakout trading strategy, trail the price and much more.
★ ★ ★ ★ ★
📈 StairSteps is an EA which can trade consolidation zones using a stairstep breakout trading strategy, trail the price and much more.
 ★ ★ ★ ★ ★
📈 Fluid is a MT4 EA with trend detector, precise entry/exit points and advanced basket trade management which can hedge and recover a loss.
★ ★ ★ ★ ★
📈 Fluid is a MT4 EA with trend detector, precise entry/exit points and advanced basket trade management which can hedge and recover a loss.
 ★ ★ ★ ★ ★
📈 Heiken Ashi expert advisor with trend detector and advanced trailing options, such as ATR, PSAR, MA, Fractals and more.
★ ★ ★ ★ ★
📈 Heiken Ashi expert advisor with trend detector and advanced trailing options, such as ATR, PSAR, MA, Fractals and more.
 ★ ★ ★ ★ ★
📈 NonLagMA is a Metatrader EA that can trade with the trend using the nonlagma indicator to determine the trend and the entries.
★ ★ ★ ★ ★
📈 NonLagMA is a Metatrader EA that can trade with the trend using the nonlagma indicator to determine the trend and the entries.
 ★ ★ ★ ★ ★
📈 Auto Recovery is a MT4 EA that can successfully hedge a losing trade or a basket of trades until it will reach breakeven.
★ ★ ★ ★ ★
📈 Auto Recovery is a MT4 EA that can successfully hedge a losing trade or a basket of trades until it will reach breakeven.
 ★ ★ ★ ★ ★
📈 News was designed to trade news events in an OCO approach and can open multiple trades during the same event.
★ ★ ★ ★ ★
📈 News was designed to trade news events in an OCO approach and can open multiple trades during the same event.
 ★ ★ ★ ★ ★
📈 MACD was designed to trade using MACD while following the trend and the signals from the Stochastic indicator.
★ ★ ★ ★ ★
📈 MACD was designed to trade using MACD while following the trend and the signals from the Stochastic indicator.
 ★ ★ ★ ★ ★
📈 Trailing Stop is a Metatrader expert adisor designed to trail the price using various methods (ATR, MA, chandelier etc.).
★ ★ ★ ★ ★
📈 Trailing Stop is a Metatrader expert adisor designed to trail the price using various methods (ATR, MA, chandelier etc.).
 ★ ★ ★ ★ ★
📈 Renko Expert Advisors is a set of two EAs, Renko Chart and Renko Trader, that can successfully trade with the trend on renko.
★ ★ ★ ★ ★
📈 Renko Expert Advisors is a set of two EAs, Renko Chart and Renko Trader, that can successfully trade with the trend on renko.
 ★ ★ ★ ★ ★
📈 Traders Dynamic Index expert advisor that can trade with the trend following the TDI trading strategy.
★ ★ ★ ★ ★
📈 Traders Dynamic Index expert advisor that can trade with the trend following the TDI trading strategy.
 ★ ★ ★ ★ ★
📈 Price Channel Expert Advisor for MetaTrader trades within the support/resistance levels, following the up or down trends.
★ ★ ★ ★ ★
📈 Price Channel Expert Advisor for MetaTrader trades within the support/resistance levels, following the up or down trends.
 ★ ★ ★ ★ ★
📈 Grid expert advisor can trade following a grid trading strategy while following signals from Stochastic.
★ ★ ★ ★ ★
📈 Grid expert advisor can trade following a grid trading strategy while following signals from Stochastic.


 Download NOW!
No comments:
Post a Comment