Technical outlook:
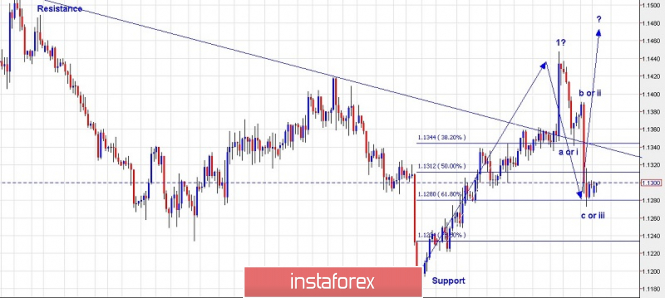
The H4 chart for EUR/USD has been presented here with potential wave counts which could reflect the medium-term outlook. Please note that the EURUSD pair has reached the support range between the 1.1280 and 1.1340 levels, respectively. On Friday, an intraday low was made at the 1.1273 levels before pulling back towards 1.1300. The potential wave structure could be defined as an impulse wave between 1.1175 and 1.1443, labelled as Wave 1 on the chart here. The drop can be seen as corrective (a-b-c), but we have kept the alternate count open which could produce a 5 wave drop from the 1.1443 levels. If the prices manage to hold above the 1.1273 levels, the next move should be bullish towards the 1.1700/1.1800 levels. As an alternative, if the prices drop below the 1.1273 levels producing an impulse, we would look out for a potential short opportunity on a pullback rally. For now, we remain on the higher side.
Trading plan:
Remain long, stop below the 1.1273 levels, the target is open.
Good luck!
The material has been provided by InstaForex Company - www.instaforex.com


 Download NOW!
No comments:
Post a Comment