
Technical Market Overview:
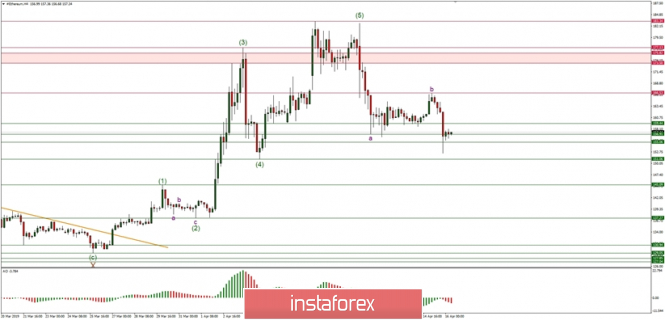
The ETH/USD pair has completed the corrective cycle in wave b at the level of $166 and reversed sharply to start the wave c to the downside as anticipated. The price has broken below the technical support at the levels of $159, $156 and $155 to make a bottom at the level of $152. The target is still seen at the level of $151, but we can see the positive divergence building between the price and the momentum indicator, so the market might be near to complete the corrective cycle.
Weekly Pivot Points:
WR3 - $201
WR2 - $192
WR1 - $173
Weekly Pivot - $164
WS1 - $148
WS2 - $138
WS3 - $120
Trading Recommendations:
The best trading strategy for this market for daytraders is to trade with the longer-timeframe trend, which is now an uptrend. The good level to place a buy order is just above the level of $152. This point of view is valid as long as the technical support at the level of $151 is broken.


 Download NOW!
No comments:
Post a Comment