
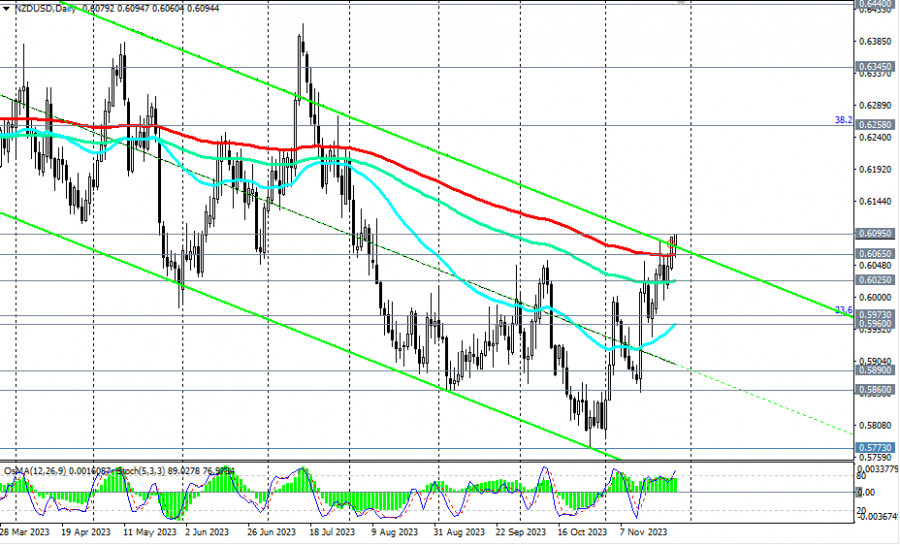
NZD/USD rose by 3.4% over the past two weeks amid the weakening U.S. dollar. The pair has broken through the key medium-term resistance level of 0.6065 (200 EMA on the daily chart), which separates the medium-term bearish market from the bullish one, and has approached the important resistance levels of 0.6095 (50 EMA on the weekly chart) and 0.6100.
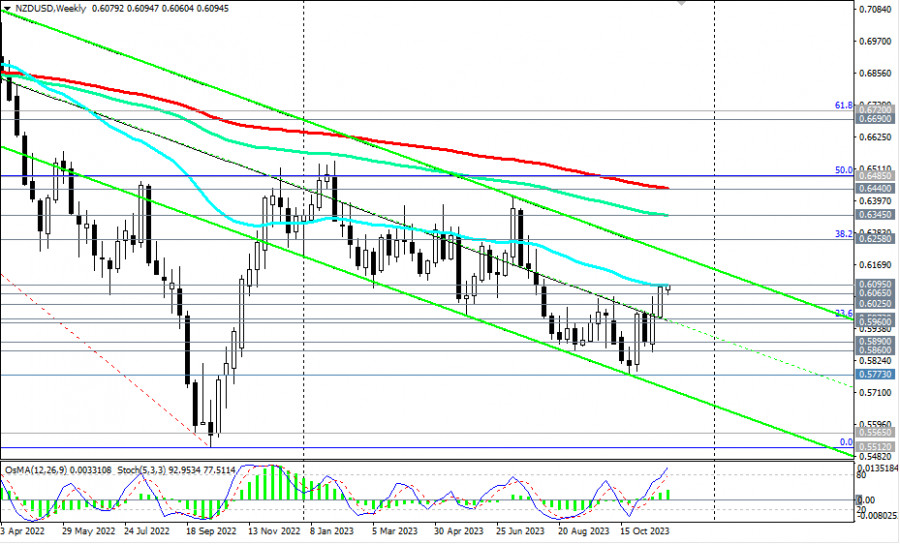
Their breakout could trigger further growth towards the resistance level of 0.6345 (144 EMA on the weekly chart). The breakout of the key resistance level of 0.6440 (200 EMA on the weekly chart) and the level of 0.6485 (50% Fibonacci level in the pair's downward trend from the level of 0.7465 in February 2021 to the level of 0.5510 reached in October 2022) will lead the pair into the zone of a long-term bullish market.
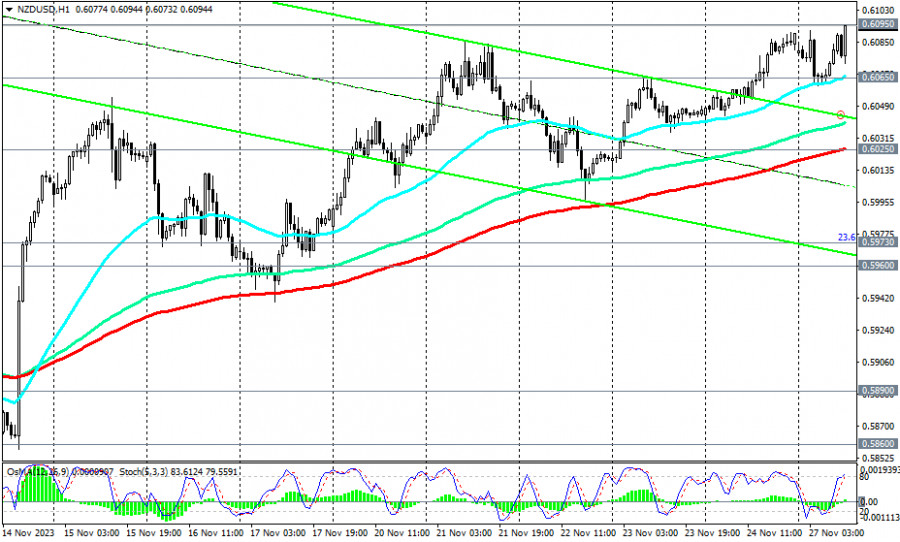
In an alternative scenario, the corrective rise of NZD/USD will stop at the current levels. In this scenario, a rebound from the resistance level of 0.6095 will occur if the market considers the accompanying statements of the RBNZ leaders on Wednesday to be too mild to continue actively buying the New Zealand dollar.
A signal for the resumption of sales could be the breakdown of the support level of 0.6065 (200 EMA on the daily chart). The break of the support level 0.6025 (144 EMA on the daily chart) will confirm this assumption.
Support levels: 0.6065, 0.6025, 0.6000, 0.5973, 0.5960, 0.5900, 0.5890, 0.5860, 0.5775
Resistance levels: 0.6095, 0.6100, 0.6200, 0.6258, 0.6300, 0.6345, 0.6400, 0.6440, 0.6485, 0.6500


 Download NOW!
No comments:
Post a Comment