
Analyzing Friday's trades:
EUR/USD on 30M chart
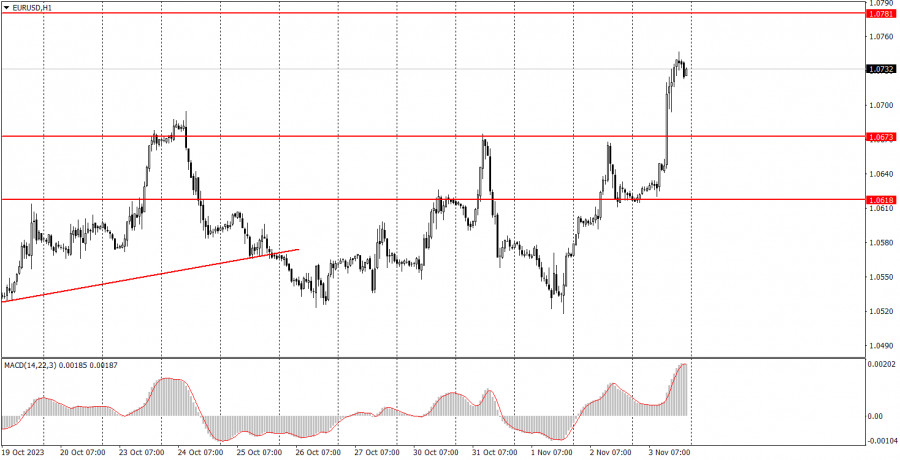
On Friday, the EUR/USD pair exhibited high volatility and strong trends. This pair's growth was primarily driven by macroeconomic data from the United States. We noted that at least three significant reports were due, each of which could trigger a strong market reaction. In practice, all three reports turned out to be resonant, and all three favored the euro. This is why we witnessed a significant decline in the dollar's value. If not for these reports, we might observe a relatively flat market.
First, the ISM non-manufacturing PMI dropped to a five-month low of 51.8 from 53.6 in September. While not critical, it was certainly unfavorable. The Nonfarm Payrolls report showed 150,000 new jobs created, falling short of the 180,000 forecast, and the previous month's figure was revised downward. The unemployment rate increased from 3.8% to 3.9%. This was more than enough to cause the US dollar to lose over 100 pips.
EUR/USD on 5M chart
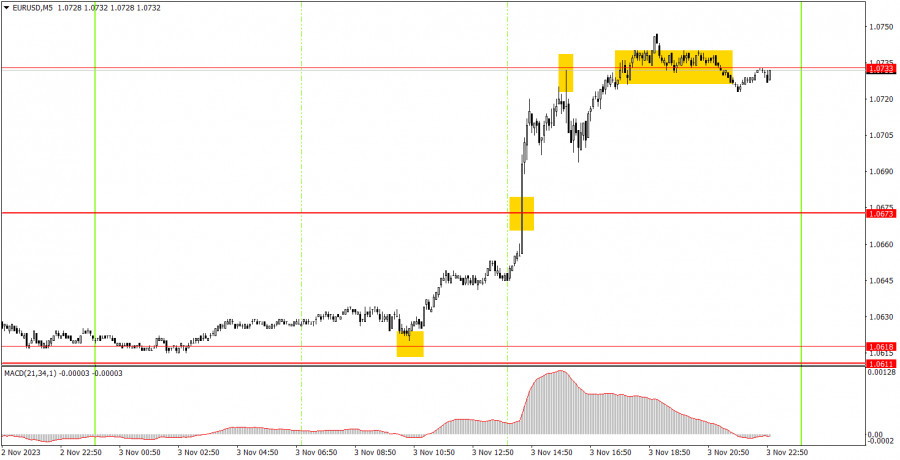
On the 5-minute chart, trading signals were somewhat limited, but even those were enough to generate a good profit. The first buy signal emerged overnight, but by the time the European session opened, the price had barely moved from the level of 1.0618. Another buy signal formed during the middle of the session, with a deviation of just 2 pips. It didn't matter which signal traders used to enter the market. Almost immediately, a powerful upward movement started. Before the release of U.S. data, traders had the option to leave the trades, but why do that when you could simply set a stop-loss to break even? The price subsequently rose to the 1.0733 level, where it bounced. At that point, it was time to close the long positions, resulting in an 85-pip profit. Traders could also consider selling when the signal to go short appeared, as it didn't result in a loss. The price fell by 15 pips, which was necessary to set a break-even stop-loss.
Trading tips on Monday:
On the 30-minute chart, the pair has already started a new phase of upward correction, but we don't know how long this will last. Take note that the pair remained stagnant for several weeks until the employment and unemployment data were released in the United States. The key levels on the 5M chart are 1.0451, 1.0483, 1.0526, 1.0568, 1.0611-1.0618, 1.0673, 1.0733, 1.0767-1.0781, 1.0835, 1.0871. A stop loss can be set at a breakeven point as soon as the price moves 15 pips in the right direction. On Monday, the final assessments of the Services PMI for October will be published in the eurozone and Germany. These are secondary data. In the United States, there are no significant events planned.
Basic trading rules:
1) Signal strength is determined by the time taken for its formation (either a bounce or level breach). A shorter formation time indicates a stronger signal.
2) If two or more trades around a certain level are initiated based on false signals, subsequent signals from that level should be disregarded.
3) In a flat market, any currency pair can produce multiple false signals or none at all. In any case, the flat trend is not the best condition for trading.
4) Trading activities are confined between the onset of the European session and mid-way through the U.S. session, post which all open trades should be manually closed.
5) On the 30-minute timeframe, trades based on MACD signals are only advisable amidst substantial volatility and an established trend, confirmed either by a trend line or trend channel.
6) If two levels lie closely together (ranging from 5 to 15 pips apart), they should be considered as a support or resistance zone.
How to read charts:
Support and Resistance price levels can serve as targets when buying or selling. You can place Take Profit levels near them.
Red lines represent channels or trend lines, depicting the current market trend and indicating the preferable trading direction.
The MACD(14,22,3) indicator, encompassing both the histogram and signal line, acts as an auxiliary tool and can also be used as a signal source.
Significant speeches and reports (always noted in the news calendar) can profoundly influence the price dynamics. Hence, trading during their release calls for heightened caution. It may be reasonable to exit the market to prevent abrupt price reversals against the prevailing trend.
Beginning traders should always remember that not every trade will yield profit. Establishing a clear strategy coupled with sound money management is the cornerstone of sustained trading success.


 Download NOW!
No comments:
Post a Comment