
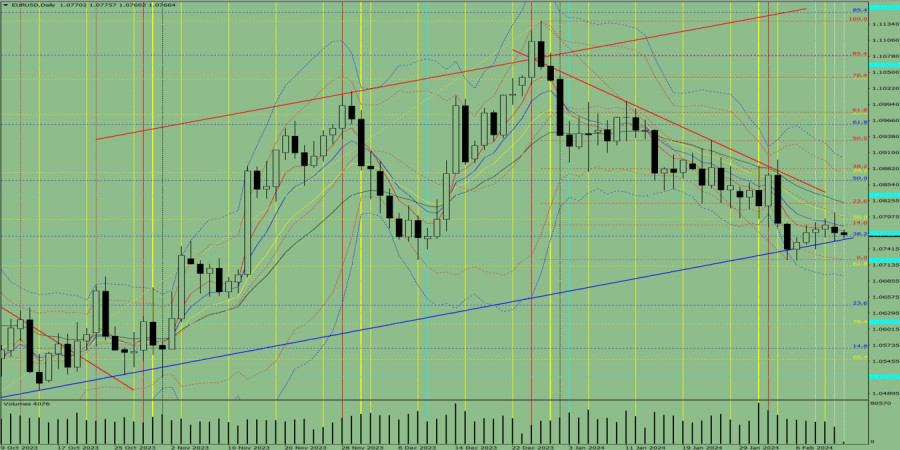
The EUR/USD currency pair may move upward from the level of 1.0770 (closing of yesterday's daily candle) to test 1.0783, the 14.6% pullback level (red dotted line), and after that, a continued upward movement is possible with a target of 1.0821, the 23.6% pullback level (red dotted line).
Fig. 1 (daily chart).
Comprehensive analysis:
* Indicator analysis – up;
* Volumes – up;
* Candlestick analysis – up;
* Trend analysis – up;
* Bollinger bands – down;
* Weekly chart – up.
General conclusion: Today, the price may move upward from the level of 1.0770 (closing of yesterday's daily candle) to test 1.0783, the 14.6% pullback level (red dotted line), and after that, a continued upward movement is possible with a target of 1.0821, the 23.6% pullback level (red dotted line).
Alternatively, from the level of 1.0770 (closing of yesterday's daily candle), the price may move upward to test the 14.6% pullback level at 1.0783 (red dotted line). From here, a downward movement is possible to 1.0723, the historical support level (blue dotted line). In the case of testing this level, the price may move up.
Stefan Doll,
Analytical expert of InstaForex
© 2007-2024
Pentru mai multe detalii, va invitam sa vizitati stirea originala.


 Download NOW!
No comments:
Post a Comment