
13.02.2024 09:38 AM
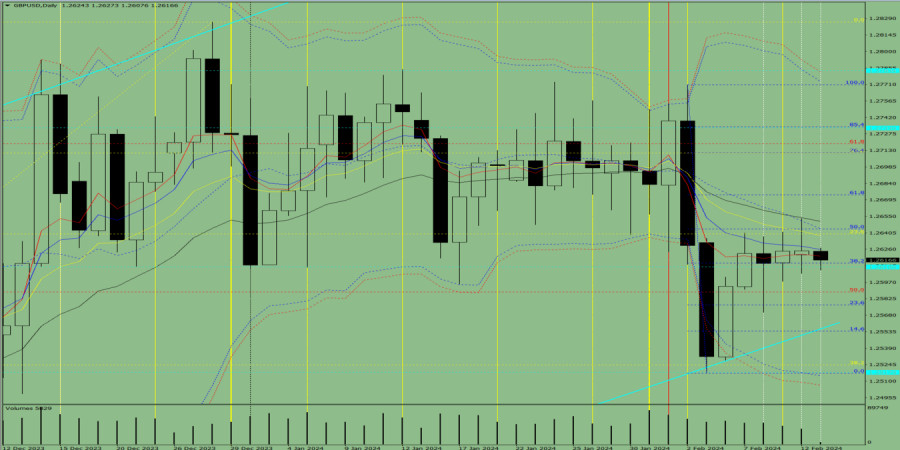
Trend analysis (Fig. 1).The GBP/USD currency pair may move downward from the level of 1.2625 (closing of yesterday's daily candle) to test the historical support level of 1.2611 (blue dotted line). Upon reaching this level, an upward movement is possible to test the 23.6% pullback level at 1.2639 (yellow dotted line). Fig. 1 (daily chart).Comprehensive analysis:Indicator analysis – up;Volumes – up;Candlestick analysis – up;Trend analysis – up;Bollinger bands – up;Weekly chart – up.General conclusion: Today, the price may move
Fresh articles are available only to premium users
Read analytics in early access, getting information first
Get
Pentru mai multe detalii, va invitam sa vizitati stirea originala.


 Download NOW!
No comments:
Post a Comment