
EUR/USD kicked off the trading week once again by providing us with "mind-boggling" volatility. The range from the daily low to the high was only 30-35 pips. We have to mention that it is extremely difficult to expect profit with such volatility even on the smallest timeframes. Moreover, the flat phase persists on the hourly time frame. In the last few days, the pair has traded higher, but any movement below the level of 1.0889 and above the Senkou Span B line (1.0792) is simply part of the flat.
On Monday, the euro edged up, but what were the reasons for this? And is it worth looking for reasons for a 30-pip movement at all? We just want to say that the current movements are absolutely random, so there is no point in looking for logic in them. The pair rose on Monday, it may fall on Tuesday, all together this is called "market noise" or a "flat." Fortunately, important reports and events will take place later this week. Therefore, there is hope that the flat will not last another week or two. However, if we look at the British pound, which has been in a sideways channel for three months, anything is possible...
Obviously, there is only one thing: the market almost does not want to trade. As for trading signals, there were none on Monday. And perhaps this is for the best. With such volatility, signals are likely to be false or weak. Therefore, working with them is a way, at best, to break even in the market.
COT report:
The latest COT report is dated February 27. The net position of non-commercial traders has been persistently bullish for quite some time. Basically, the number of long positions in the market is higher than the number of short positions. However, at the same time, the net position of non-commercial traders has been decreasing in recent months, while that of commercial traders has been increasing. This shows that market sentiment is turning bearish, as speculators are increasing the volume of short positions on the euro. We don't see any fundamental factors that can support the euro's growth in the long term, while technical analysis also points to the formation of a downtrend.
We have already drawn your attention to the fact that the red and blue lines have significantly diverged, often preceding the end of a trend. Currently, these lines are moving towards each other (indicating a trend change). Therefore, we believe that the euro will fall further. During the last reporting week, the number of long positions for the non-commercial group decreased by 7,900, while the number of short positions decreased by 2,800. Accordingly, the net position decreased by 5,100. The number of buy contracts is still higher than the number of sell contracts among non-commercial traders by 63,000 (previously 68,000). Thus, commercial traders continue to sell the euro.
Analysis of EUR/USD 1H
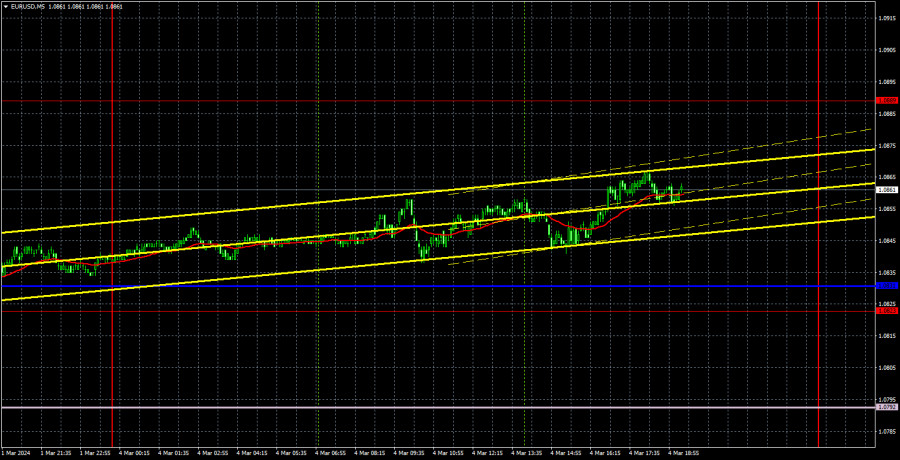
On the 1-hour chart, the uptrend remains intact, but EUR/USD has been moving in a sideways channel of 1.0792-1.0889 for the past two weeks. In our opinion, all the factors currently suggest that the dollar will strengthen. Therefore, we expect the price to consolidate below the Senkou Span B line and the euro to revive the downward movement. The nearest target is the area of 1.0658-1.0669. However, if the market continues to trade in this manner, it will take a very long time until we see any trend.
On March 5, we highlight the following levels for trading: 1.0530, 1.0581, 1.0658-1.0669, 1.0757, 1.0823, 1.0889, 1.0935, 1.1006, 1.1092, as well as the Senkou Span B line (1.0792) and Kijun-sen (1.0831). The Ichimoku indicator lines can move during the day, so this should be taken into account when identifying trading signals. Don't forget to set a Stop Loss to breakeven if the price has moved in the intended direction by 15 pips. This will protect you against potential losses if the signal turns out to be false.
On Tuesday, the eurozone and Germany will release the second estimates of the services sector business activity indices for February, which is hardly an important report. In the eurozone, we have the producer price index, another secondary report. In particular, the US ISM Non-Manufacturing Purchasing Managers' Index is scheduled for release, which is actually a key event. But will this important event be enough to end the flat?
Description of the chart:
Support and resistance levels are thick red lines near which the trend may end. They do not provide trading signals;
The Kijun-sen and Senkou Span B lines are the lines of the Ichimoku indicator, plotted to the 1H timeframe from the 4H one. They provide trading signals;
Extreme levels are thin red lines from which the price bounced earlier. They provide trading signals;
Yellow lines are trend lines, trend channels, and any other technical patterns;
Indicator 1 on the COT charts is the net position size for each category of traders;
Indicator 2 on the COT charts is the net position size for the Non-commercial group.Pentru mai multe detalii, va invitam sa vizitati stirea originala.


 Download NOW!
No comments:
Post a Comment