
Analysis of GBP/USD 5M
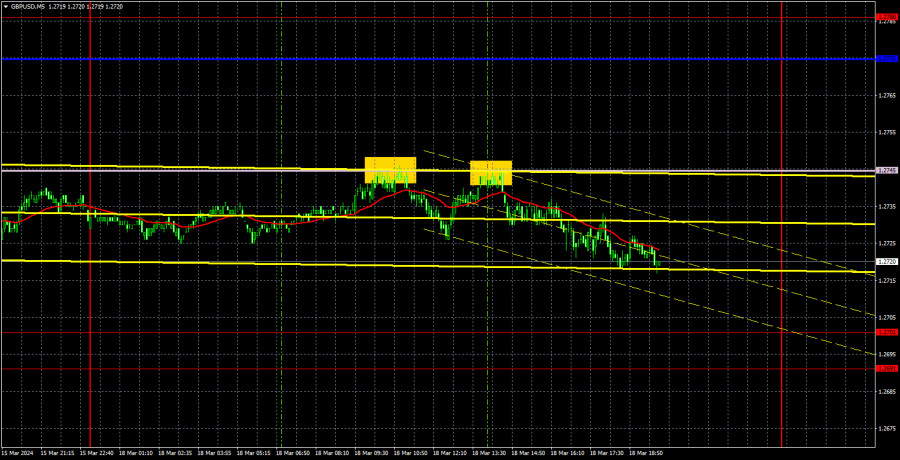
GBP/USD also did not show any interesting movements on Monday. The pair's volatility was even weaker than the euro's, but the dollar continued to rise throughout the day. On one hand, this is a good thing because this could be the start of a new downtrend, which is much more consistent and logical than any pound rally. On the other hand, the movements are so weak that it's difficult to expect a good profit even when you hold a trade for several days. Nevertheless, after the price settled below the uptrend line, selling became relevant. Therefore, you can hold these positions until buy signals form.
We have repeatedly mentioned that the British pound is unreasonably expensive and extremely overbought. Therefore, we strongly believe that the pair should fall. However, this week both the Bank of England and the Federal Reserve, as well as the UK inflation report, could spoil everything. Even the market itself could spoil everything if it starts interpreting any news in favor of the pound sterling again. So, for now, the British pound is falling for logical reasons, and it's important that it stays that way.
There were two trading signals generated on Monday. The pair bounced off the Senkou Span B line twice. In the first case, it fell by 10 pips, and in the second, by 20 pips. Therefore, traders could end Monday with low profits. There's no need to expect significant profits now since volatility is low. Most likely, it will increase as the market may start anticipating upcoming events, awaiting specific data and news.
COT report:
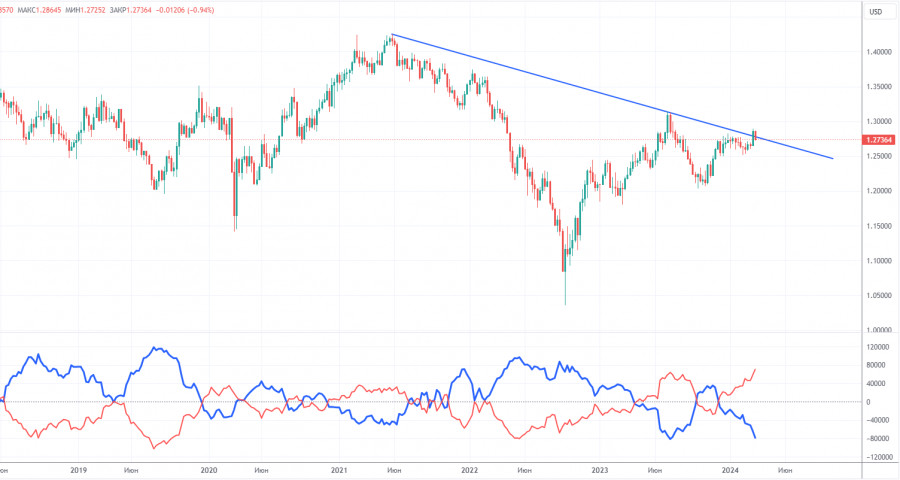
COT reports on the British pound show that the sentiment of commercial traders has frequently changed in recent months. The red and blue lines, which represent the net positions of commercial and non-commercial traders, constantly intersect and, in most cases, remain close to the zero mark. According to the latest report on the British pound, the non-commercial group opened 21,000 buy contracts and 8,900 short ones. As a result, the net position of non-commercial traders increased by 12,100 contracts in a week. Despite the fact that the net position of speculators is growing, the fundamental background still does not provide a basis for long-term purchases of the pound sterling.
The non-commercial group currently has a total of 112,300 buy contracts and 52,800 sell contracts. The bulls have a big advantage. However, in recent months, we have repeatedly encountered the same situation: the net position either increases or decreases, and the bulls or the bears either have the advantage. Since the COT reports do not provide an accurate forecast of the market's behavior at the moment, we have to scrutinize the technical picture and economic reports. The technical analysis suggests that there's a possibility that the pound could show a pronounced downward movement (descending trend line), but there is currently no sell signal on the higher time frames.
Analysis of GBP/USD 1H
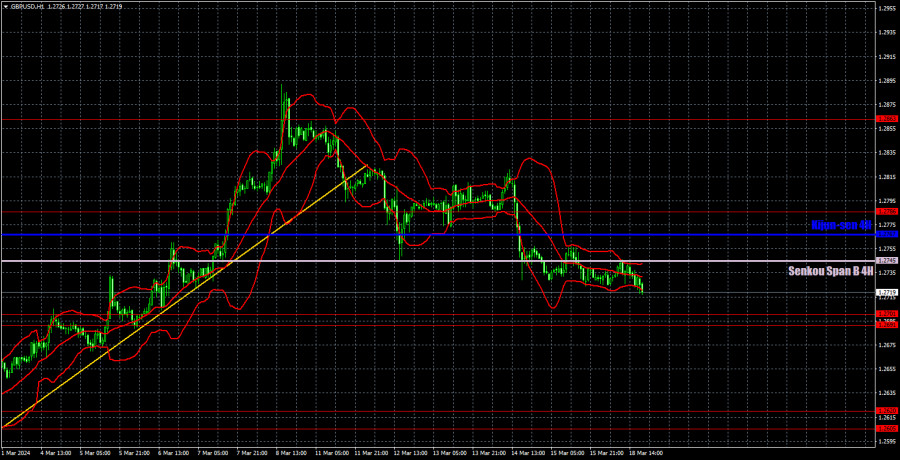
On the 1H chart, GBP/USD is attempting to form a new downtrend. The economic reports and the fundamental background do not support the British pound, but we have already seen something similar in the second half of 2023. Back then, the pound also rose for no apparent reasons. If the price consolidates below the trendline and the Ichimoku indicator lines, we can hope that the pair may start a small downward movement, but this could quickly end if the market interprets the UK inflation data and the outcomes of the BoE and the Fed meetings in favor of the pound.
As of March 18, we highlight the following important levels: 1.2215, 1.2269, 1.2349, 1.2429-1.2445, 1.2516, 1.2605-1.2620, 1.2691, 1.2786, 1.2863, 1.2981-1.2987. The Senkou Span B line (1.2745) and the Kijun-sen line (1.2767) can also serve as sources of signals. Don't forget to set a Stop Loss to breakeven if the price has moved in the intended direction by 20 pips. The Ichimoku indicator lines may move during the day, so this should be taken into account when determining trading signals.
On Tuesday, the UK economic calendar is empty, while the US will only release two secondary reports. However, the market may start reacting to future events, so we expect higher volatility. And, of course, the dollar may rise.
Description of the chart:
Support and resistance levels are thick red lines near which the trend may end. They do not provide trading signals;
The Kijun-sen and Senkou Span B lines are the lines of the Ichimoku indicator, plotted to the 1H timeframe from the 4H one. They provide trading signals;
Extreme levels are thin red lines from which the price bounced earlier. They provide trading signals;
Yellow lines are trend lines, trend channels, and any other technical patterns;
Indicator 1 on the COT charts is the net position size for each category of traders;
Indicator 2 on the COT charts is the net position size for the Non-commercial group.
The material has been provided by InstaForex Company - www.instaforex.com #


 Download NOW!
No comments:
Post a Comment