
Analysis of EUR/USD 5M
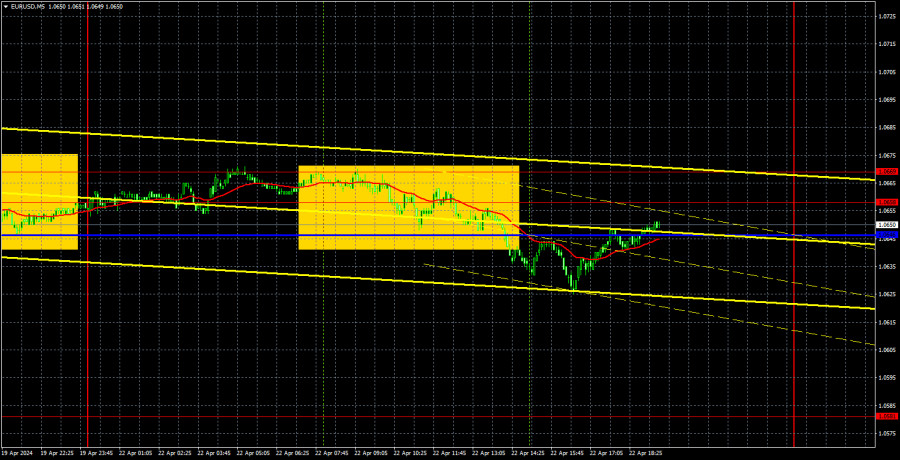
EUR/USD traded mostly sideways with low volatility on Monday. We have seen the same movement for six days now, so we have formed a channel that illustrates the current direction. It is moderately upward but very close to sideways. The euro has stopped falling, but no one expects the pair to drop every day. The fundamental and macroeconomic background still suggests that the dollar will rise, so we expect the euro to fall in any case.
On Monday, European Central Bank President Christine Lagarde delivered a speech, but, as we warned you, she did not announce anything important. This is clearly evident in the pair's volatility, which was less than 40 pips. It is clear that if Lagarde had shared important information, the market reaction would have followed. Instead, we saw another "boring Monday", although in reality, the pair has been almost flat for a week now. Since yesterday the price reversed near the lower boundary of the channel, today it may move towards the upper boundary. However, we will remind you that price movements within a sideways channel are often random and unpredictable.
Since volatility was low, it was difficult to expect strong signals during the day. The pair stayed within the 1.0646-1.0669 range throughout the European trading session, and it only managed to settle below this mark during the opening of the US session. However, the pair did not sharply fall as the price did not even fall by 15 pips. Therefore, the trade could be manually closed at breakeven closer to the evening when it became clear that the pair would no longer show any movement.
COT report:
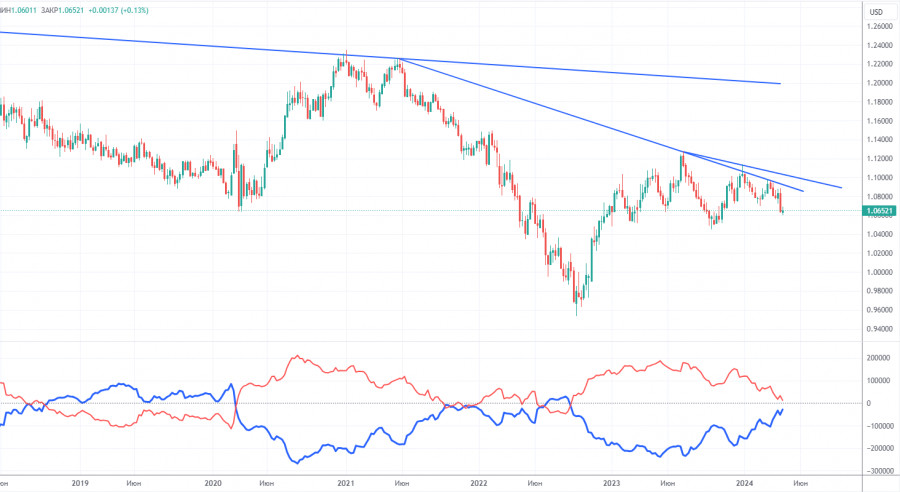
The latest COT report is dated April 16. The net position of non-commercial traders has been bullish for quite some time. Basically, the number of long positions in the market is higher than the number of short positions. However, at the same time, the net position of non-commercial traders (red line) has been decreasing in recent months, while that of commercial traders (blue line) has been increasing. This shows that market sentiment is turning bearish, as speculators increasingly sell the euro. Furthermore, we don't see any fundamental factors that can support the euro's strength, while technical analysis also suggests a downtrend. Three descending trend lines on the weekly chart indicate that there's a good chance of sustaining the decline.
At present, the red and blue lines are moving towards each other (indicating a trend reversal after a rise). Therefore, we believe that the euro will fall further. During the last reporting week, the number of long positions for the non-commercial group increased by 3,500, while the number of short positions increased by 21,500. Accordingly, the net position decreased by 21,500. Overall, both the euro and the net position continue to decline. The number of buy contracts is higher than the number of sell contracts among non-commercial traders by only 12,000 (previously 32,700).
Analysis of EUR/USD 1H
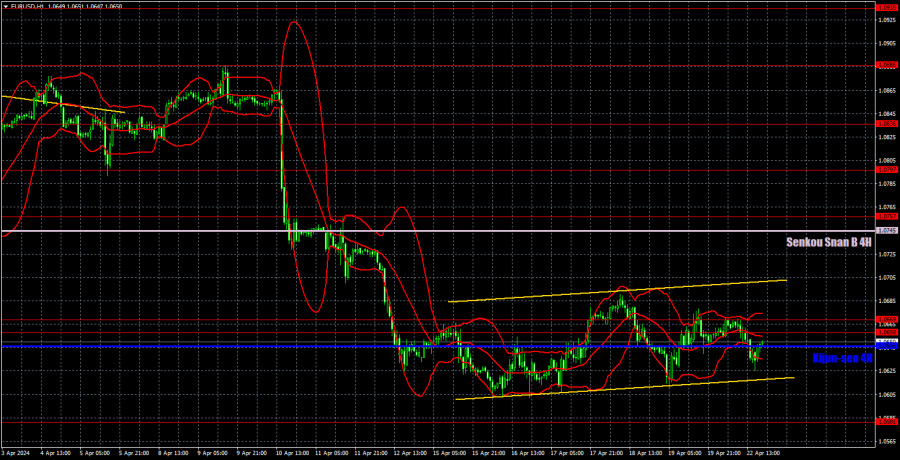
On the 1-hour chart, EUR/USD resumed its downward trend but has remained in a flat pattern for a week now. Since expectations for a Fed rate cut in 2024 have significantly decreased, the US dollar can and should continue to rise for a couple more months at least. Especially in light of the upcoming European Central Bank rate cut in June. Practically all the factors suggest downward movement for the pair. The market needs to take a break for some time, but we do not expect upward movements to be stronger than the correction.
On April 23, we highlight the following levels for trading: 1.0530, 1.0581, 1.0658-1.0669, 1.0757, 1.0797, 1.0836, 1.0886, 1.0935, 1.1006, 1.1092, as well as the Senkou Span B (1.0745) and Kijun-sen (1.0646) lines. The Ichimoku indicator lines can move during the day, so this should be taken into account when identifying trading signals. Don't forget to set a Stop Loss to breakeven if the price has moved in the intended direction by 15 pips. This will protect you against potential losses if the signal turns out to be false.
On Tuesday, Services and Manufacturing PMI data will be published in Germany, the European Union, and the United States. US indexes are less significant for the market than European ones because the United States has its own ISM indexes. Therefore, we only expect a market reaction in the morning if the actual values differ from the forecast by more than 0.2-0.3 points.
Description of the chart:
Support and resistance levels are thick red lines near which the trend may end. They do not provide trading signals;
The Kijun-sen and Senkou Span B lines are the lines of the Ichimoku indicator, plotted to the 1H timeframe from the 4H one. They provide trading signals;
Extreme levels are thin red lines from which the price bounced earlier. They provide trading signals;
Yellow lines are trend lines, trend channels, and any other technical patterns;
Indicator 1 on the COT charts is the net position size for each category of traders;
The material has been provided by InstaForex Company - www.instaforex.com #


 Download NOW!
No comments:
Post a Comment