Analysis of GBP/USD 5M

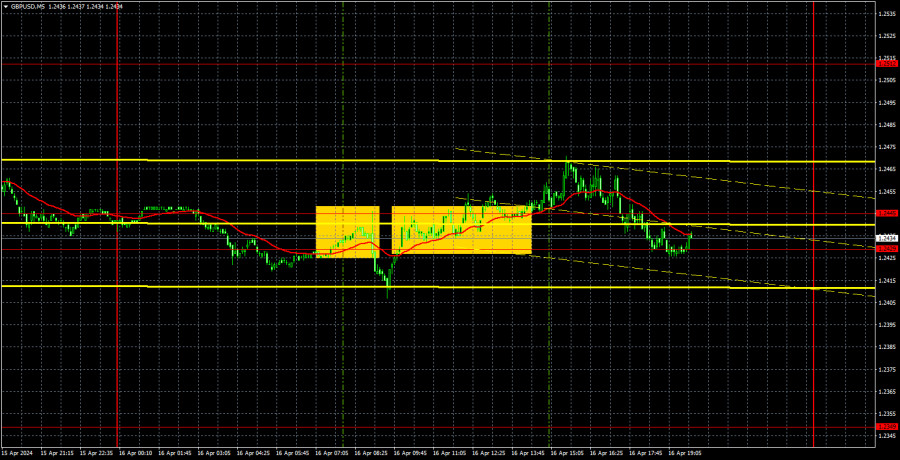
GBP/USD traded with low volatility, but it was still heading downwards. This is the only thing that is encouraging at the moment. Recall that the pound has been stuck in a sideways channel for a long time and only managed to break out of it last week. Now the British currency has only one way to go – down. The market has refrained from selling the British pound for a long time, but now it no longer has any reason to continue doing so. The US macroeconomic backdrop (as before) is much stronger than that of Britain, and the Bank of England may start lowering the key rate even before the Federal Reserve, which was extremely difficult to believe at the beginning of this year. From a technical perspective, a downward trend persists on all timeframes.
Yesterday, the UK published reports on unemployment data, unemployment benefit claims, and wages. The reports turned out mixed. While the unemployment rate increased more than forecasted, the number of jobless claims was lower than market expectations. Average wages rose by 5.6%, which matched experts' forecasts. Thus, the pound did not receive support, and neither was it under pressure. On the other hand, the US released secondary reports. Since two out of three reports were weaker than expected, the US dollar came under short-term market pressure, but by evening, it managed to rise again. We insist that the US dollar rise regardless of volatility.
Tuesday's trading signals were consistent with the nature of the movements. Initially, the pair rebounded from the lower bound of the range 1.2429-1.2445, then it settled above it. In both cases, the price did not move in the intended direction by at least 20 pips. We already warned you that the pair could show weak movements, but frequent reversals could be observed throughout the day due to the large number of economic reports.
COT report:

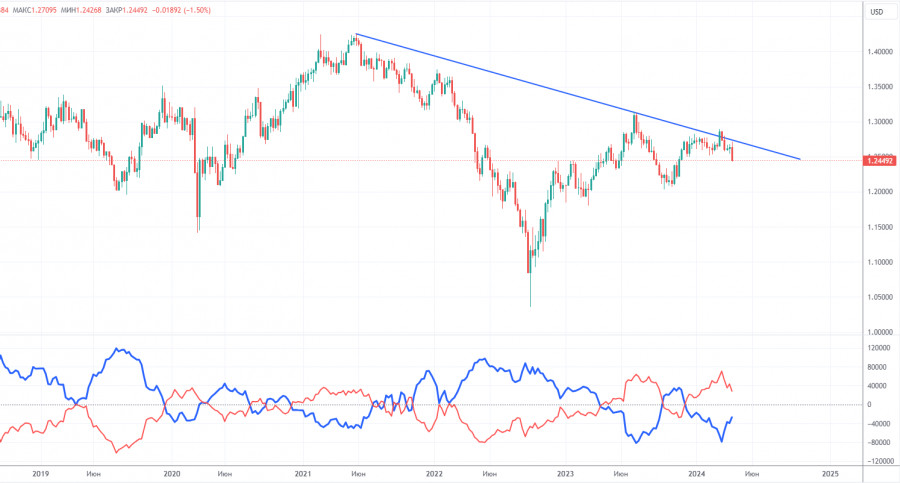
COT reports on the British pound show that the sentiment of commercial traders has frequently changed in recent months. The red and blue lines, which represent the net positions of commercial and non-commercial traders, constantly intersect and, in most cases, remain close to the zero mark. According to the latest report on the British pound, the non-commercial group closed 18,400 buy contracts and 3,200 short ones. As a result, the net position of non-commercial traders decreased by 15,200 contracts in a week. The fundamental background still does not provide a basis for long-term purchases of the pound sterling, and the currency finally has a real chance to end the flat period. The trend line on the 24-hour TF clearly indicates what trend we are currently in.
The non-commercial group currently has a total of 80,000 buy contracts and 51,700 sell contracts. The bulls no longer have a significant advantage. Therefore, the pound has a huge potential to fall. We can only hope that inflation in the UK will not start to accelerate, or that the Bank of England will not intervene.
Analysis of GBP/USD 1H

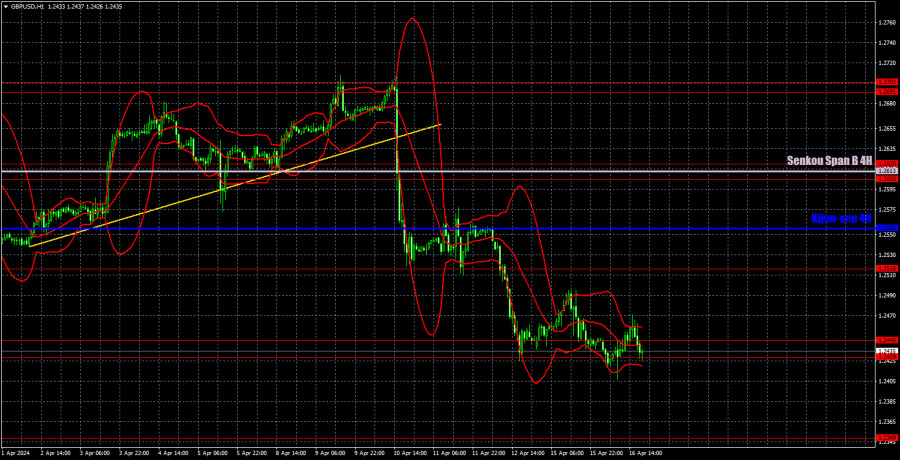
On the 1H chart, GBP/USD has left the sideways channel of 1.25-1.28. A downtrend may resume, and the pair has the potential to fall by at least 400-500 pips. The fundamental and macroeconomic background continues to support the dollar, as the US economy is much stronger than the UK, and the Fed keeps pushing back the first rate cut to a later date. As a result, even the BoE may lower its key rate sooner, and this will weigh on the pound.
As of April 17, we highlight the following important levels: 1.2215, 1.2269, 1.2349, 1.2429-1.2445, 1.2516, 1.2605-1.2620, 1.2691-1.2701, 1.2786, 1.2863, 1.2981-1.2987. The Senkou Span B line (1.2613) and the Kijun-sen line (1.2556) lines can also serve as sources of signals. Don't forget to set a Stop Loss to breakeven if the price has moved in the intended direction by 20 pips. The Ichimoku indicator lines may move during the day, so this should be taken into account when determining trading signals.
Today, the UK will release the most important report of the week – the inflation report. This indicator carries a significant weight at the moment. If it turns out that inflation has decreased to 3.1% y/y or even lower, the pound may face a mass sell-off as the first rate cut in the UK becomes much closer. However, if inflation does not decrease as much as expected, then the pound may even manage to rise today.
Description of the chart:
Support and resistance levels are thick red lines near which the trend may end. They do not provide trading signals;
The Kijun-sen and Senkou Span B lines are the lines of the Ichimoku indicator, plotted to the 1H timeframe from the 4H one. They provide trading signals;
Extreme levels are thin red lines from which the price bounced earlier. They provide trading signals;
Yellow lines are trend lines, trend channels, and any other technical patterns;
Indicator 1 on the COT charts is the net position size for each category of traders;
The material has been provided by InstaForex Company - www.instaforex.com #


 Download NOW!
No comments:
Post a Comment