Analysis of GBP/USD 5M

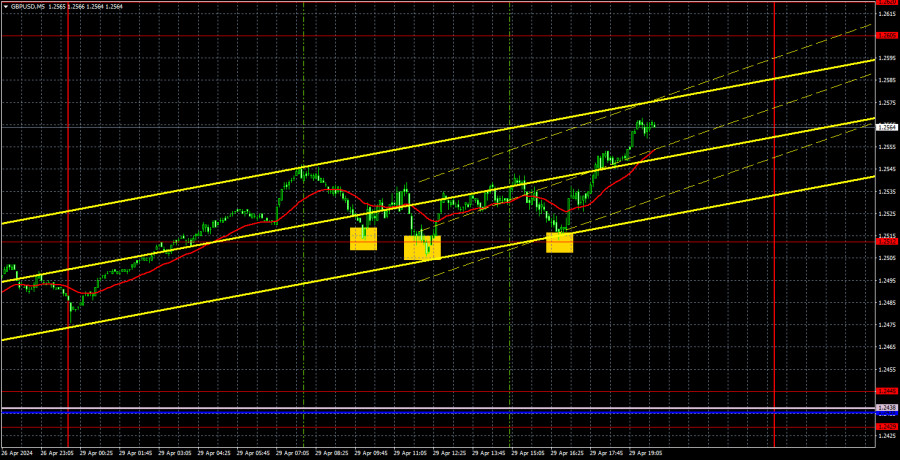
GBP/USD continued its upward movement on Monday. The pound had no reason to rise other than being in a new upward channel formed on the hourly timeframe. Initially, the upward movement was consistent from a technical perspective. Occasionally, any instrument must go through corrections. However, the bullish correction has remained intact for a week now. During this time, the pair has risen by 270 pips, while the entire preceding leg of decline amounted to 410 pips. There were quite substantial reasons for the recent decline, but for the current rise (especially on Monday), there were practically none.
Therefore, we are forced to say that the British pound is showing baseless growth once again. For now, we cannot confidently assert that the downtrend has resumed after the completion of the 4-month flat. Some unknown force is pulling the British currency upwards, contrary to COT reports, fundamental, and macroeconomic analysis. An ascending channel has formed on the hourly timeframe, so we can determine the end of the upward movement once the price leaves this channel. However, in the medium term, who said that this is the last phase of growth if the pound doesn't need any news, reports, or events to strengthen? In general, the pair has returned to a sideways channel where it spent 4 months...
Three trading signals were formed near the level of 1.2512 yesterday. In all three cases, these were rebounds from the level. In the first case, the price failed to move up by 20 pips, so at the time of forming the second signal, traders should have simply stayed in long positions. This trade closed at breakeven by Stop Loss. Traders could earn about 30 pips using the third signal. It was advisable to manually close the last trade closer to the evening.
COT report:

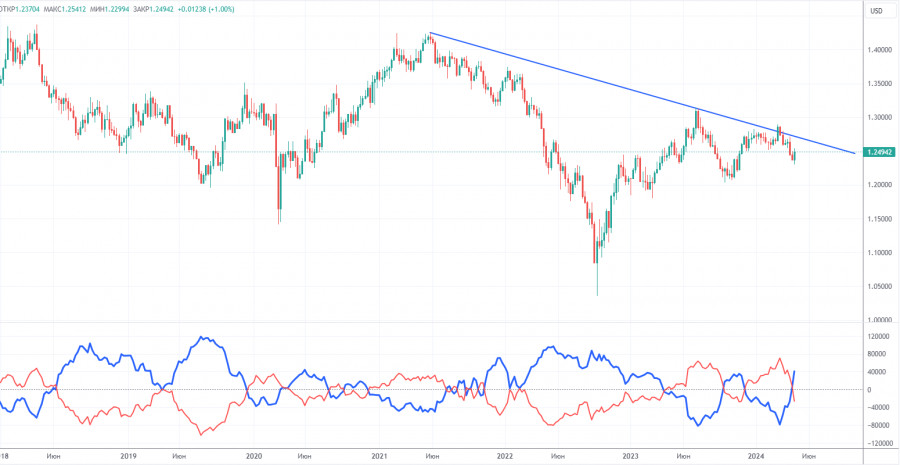
COT reports on the British pound show that the sentiment of commercial traders often changes in recent years. The red and blue lines, which represent the net positions of commercial and non-commercial traders, constantly intersect and, in most cases, remain close to the zero mark. According to the latest report on the British pound, the non-commercial group closed 23,300 buy contracts and opened 11,500 short ones. As a result, the net position of non-commercial traders decreased a whopping 34,800 contracts in a week, which is a significant amount for the pound. Consequently, sellers continue to hold their ground. The fundamental background still does not provide a basis for long-term purchases of the pound sterling, and the currency finally has a real chance to resume the global downward trend. The trend line on the 24-hour TF clearly shows this. Practically all factors point to the pound's decline.
The non-commercial group currently has a total of 48,500 buy contracts and 74,700 sell contracts. Now the bears are in control and the pound has a huge potential to fall. We can only hope that inflation in the UK does not accelerate, or that the Bank of England will not intervene.
Analysis of GBP/USD 1H

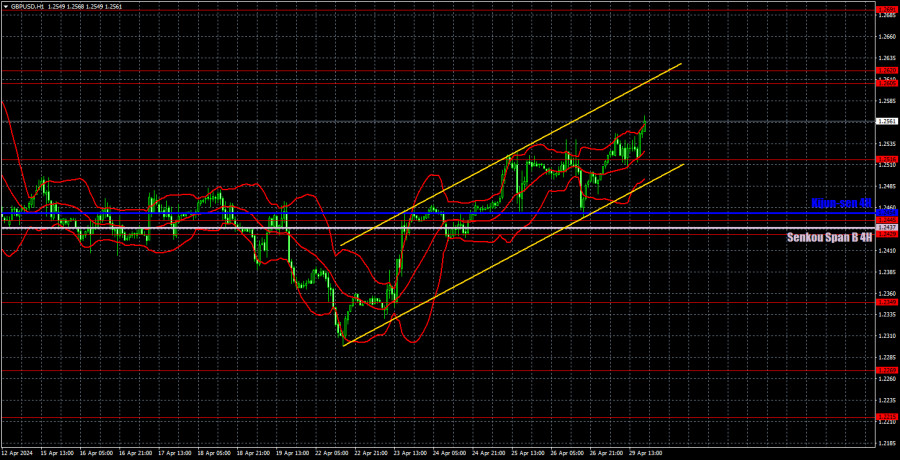
On the 1H chart, GBP/USD continues its upward movement, which could turn into anything. It could be the start of a new, logical uptrend. It could suggest a continuation of the sideways movement. Perhaps we are currently witnessing a strong correction, afterwards the pound could fall. The problem lies in the fact that the pound moves in an illogical manner. Therefore, it is extremely difficult to predict its movements.
As of April 30, we highlight the following important levels: 1.2215, 1.2269, 1.2349, 1.2429-1.2445, 1.2516, 1.2605-1.2620, 1.2691-1.2701, 1.2786, 1.2863, 1.2981-1.2987. The Senkou Span B (1.2437) and Kijun-sen (1.2454) lines can also serve as sources of signals. Don't forget to set a Stop Loss to breakeven if the price has moved in the intended direction by 20 pips. The Ichimoku indicator lines may move during the day, so this should be taken into account when determining trading signals.
On Tuesday, there are no important events scheduled in the UK and the US. However, we still expect the pound to rise. The ascending channel provides clear guidance, so we don't expect the downtrend to resume until the price consolidates below the Ichimoku indicator lines. The pound does not require fundamental or macroeconomic support to rise.
Description of the chart:
Support and resistance levels are thick red lines near which the trend may end. They do not provide trading signals;
The Kijun-sen and Senkou Span B lines are the lines of the Ichimoku indicator, plotted to the 1H timeframe from the 4H one. They provide trading signals;
Extreme levels are thin red lines from which the price bounced earlier. They provide trading signals;
Yellow lines are trend lines, trend channels, and any other technical patterns;
Indicator 1 on the COT charts is the net position size for each category of traders;
The material has been provided by InstaForex Company - www.instaforex.com #


 Download NOW!
No comments:
Post a Comment