
There are hardly any important events for the US dollar. The dollar remains under pressure, but the news background has a very weak influence on market sentiment. Therefore, the fewer the news, the better. Trading volumes will likely remain low, but the absence of news will make it impossible to interpret any of it against the dollar. It is important for the market to move away from the "sell the dollar" model right now. A calm news background could help with this.
We can highlight the GDP report for the first quarter, which will be released on Thursday. On the following day, the personal consumption expenditures price index and reports on personal spending and income of American consumers will be published. As mentioned, there are very few reports. The second preliminary GDP estimate is unlikely to interest the market. Friday's data are not important as well. Therefore, the market will be focused on analyzing the Eurozone inflation report.
As I mentioned before, given the current circumstances, this can probably help the US dollar. For the EUR/USD pair, we still have an important level at 1.0880, which will be difficult to overcome. Both instruments maintain a bullish bias, but it will be difficult to fuel this sentiment in the upcoming week. I still expect the bullish bias to dwindle down, so I will continue to look for favorable moments to sell. If the euro and pound rise even with an empty calendar, it will be possible to conclude that the market is buying these currencies not "because of" but "despite" the circumstances.
In this case, I suggest either waiting for this paradigm to leave the minds of most market participants or working in accordance with it, ignoring the news background and wave analysis.
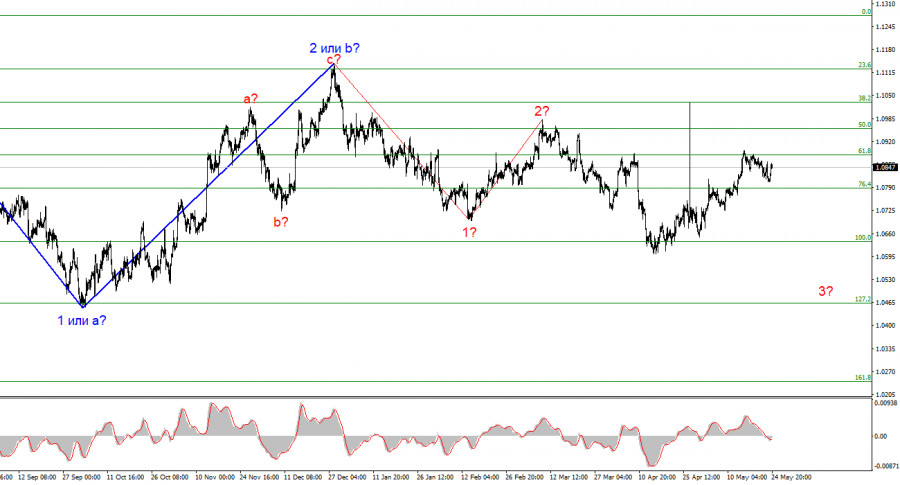
Wave analysis for EUR/USD:
Based on the conducted analysis of EUR/USD, I conclude that a bearish wave set is being formed. In the near future, I expect an impulsive downward wave 3 in 3 or c to form with a significant decline in the instrument. I anticipate a favorable moment for new short positions with targets around the 1.0462 mark. An unsuccessful attempt to break through the 1.0880 mark, which corresponds to 61.8% by Fibonacci, may indicate that the market is ready to sell, but it may not be the only one.
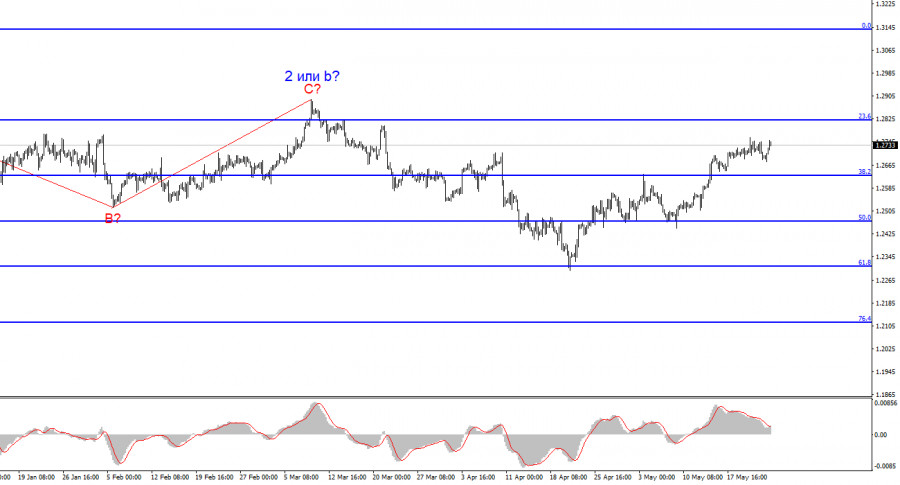
Wave analysis for GBP/USD:
The wave pattern of the GBP/USD instrument suggests a decline. I am considering selling the instrument with targets below the 1.2039 level, because I believe that wave 3 or c has not yet been canceled. A successful attempt to break 1.2625, which corresponds to 38.2% Fibonacci by Fibonacci from above, will indicate the possible end of an internal, corrective wave 3 or c, which looks like a classic three-wave pattern.
Key principles of my analysis:
Wave structures should be simple and understandable. Complex structures are difficult to work with, and they often bring changes.
If you are not confident about the market's movement, it would be better not to enter it.
We cannot guarantee the direction of movement. Don't forget about Stop Loss orders.
Wave analysis can be combined with other types of analysis and trading strategies.
The material has been provided by InstaForex Company - www.instaforex.com #


 Download NOW!
No comments:
Post a Comment