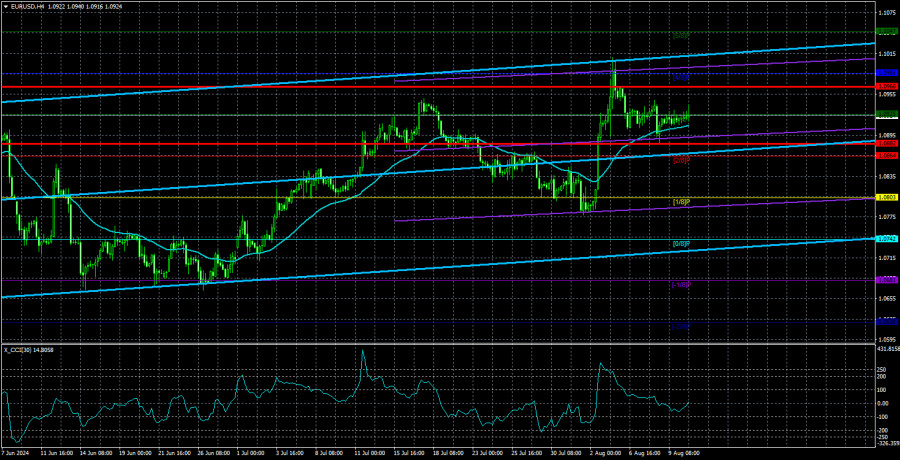
The EUR/USD pair traded with low volatility on Monday. The market showed no inclination to trade before the release of important reports, of which there will only be a few. Of course, this week's standout report is the U.S. inflation report, which will determine the dollar's fate. Remember, the key point for the EUR/USD pair remains the horizontal channel in the 24-hour time frame. This channel is 1.0600–1.1000. As long as the price does not firmly break out of this range, discussing the pair's medium-term direction is pointless. Since the last rebound occurred near the channel's upper boundary, we expect a decline towards the lower boundary, regardless of the fundamental and macroeconomic backdrop.
However, it's important to note that recent U.S. inflation reports have triggered significant market volatility. Even in cases where inflation appears to have a minor deviation from forecasts (or exactly matches them), the dollar can move up or down by 50-100 pips, which is a significant move given the current market volatility. Therefore, traders should focus on this report this week.
What to expect from U.S. inflation? Frankly, we are skeptical about the expectations of a slowdown. Even if forecasts are met, and inflation falls to 2.9%, does this level provide the Federal Reserve with grounds to begin easing monetary policy in September? In our view, no. The 2.9% level is too far from the target of 2%. Remember, the European Central Bank began lowering rates at an inflation level of 2.4% and the Bank of England at 2%. If the U.S. economy faced insurmountable problems, we would understand the Fed's desire to stabilize it as quickly as possible. But the U.S. economy is doing well, showing a growth of 2.8% in the second quarter, much higher than in the E.U. or the U.K.
The same applies to the U.S. labor market. If NonFarm Payrolls were approaching zero every month, there would be no questions. However, every month, the American economy creates 100,000 to 200,000 new jobs. Yes, the report's values are often weaker than forecasts and expectations, but who is to blame? Aren't the experts who set inflated expectations the ones at fault? We believe the U.S. labor market is cooling but remains very stable. Therefore, there is no cause for concern.
The unemployment rate in the U.S. is rising, but this is also normal during a period of high Fed rates. The Fed representatives have repeatedly stated that cooling the labor market (which includes rising unemployment) is necessary to reduce inflation. It turns out that the central bank itself does not see any problems with rising unemployment and a shrinking labor market, but the market has decided that an urgent rate cut is needed. Thus, with the inflation report on Wednesday, we may see a new decline in the dollar. However, inflation will strongly support the dollar if it rises or remains at 3%.

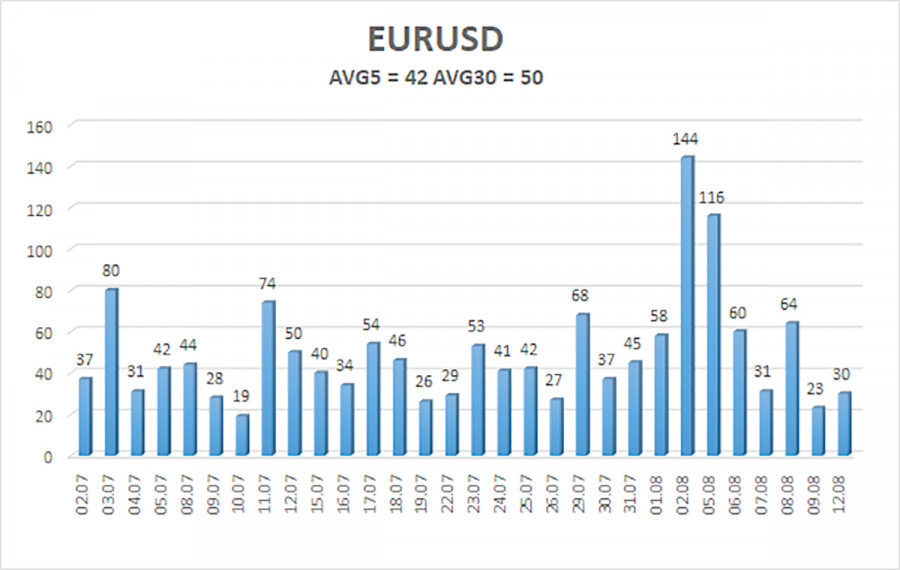
The average volatility of EUR/USD over the past five trading days as of August 13 is 42 pips, which is considered low. We expect the pair to move between the levels of 1.0882 and 1.0966 on Tuesday. The higher linear regression channel is directed upwards, but the global downtrend remains intact. The CCI indicator entered the overbought area for the second time, again warning of a potential shift to a downtrend.
Nearest Support Levels:
- S1 – 1.0864
- S2 – 1.0803
- S3 – 1.0742
Nearest Resistance Levels:
- R1 – 1.0925
- R2 – 1.0986
- R3 – 1.1047
Trading Recommendations:
The EUR/USD pair maintains a global downward trend, and in the 4-hour time frame, it started a bearish correction, which could mark the start of a new downtrend phase. In previous reviews, we mentioned that we only expect declines from the euro. We believe the euro cannot start a new global trend amid the European Central Bank's monetary policy easing, so the pair will likely fluctuate between 1.0600 and 1.1000 for some time. For now, the price has bounced off the upper boundary of the horizontal channel and is heading towards the lower boundary. Unfortunately, volatility is once again very low.
Explanations for Illustrations:
Linear Regression Channels: help determine the current trend. If both are directed in the same direction, it means the trend is strong.
Moving Average Line (settings 20,0, smoothed): determines the short-term trend and the direction in which trading should be conducted.
Murray Levels: target levels for movements and corrections.
Volatility Levels (red lines): the probable price channel in which the pair will spend the next 24 hours, based on current volatility indicators.
CCI Indicator: Entering the oversold area (below 250) or the overbought area (above +250) means a trend reversal is approaching.
The material has been provided by InstaForex Company - www.instaforex.com #


 Download NOW!
No comments:
Post a Comment