The GBP/USD pair also showed no interesting movement on Monday. This is unsurprising, as there were no reports, events, or news throughout the day. The market had nothing to react to. On the other hand, this week, a significant amount of important macroeconomic data will be released, particularly concerning the GBP/USD pair. British unemployment, GDP, and inflation will also be published, in addition to U.S. inflation, which takes the top spot in the news. These data will have less impact on market sentiment, but they should not be dismissed.
We believe this week will depend heavily on the UK and the U.S. inflation figures. The market always reacts coolly to GDP and unemployment figures. Monetary policy from the Bank of England and the Federal Reserve occupies traders' minds. This is straightforward, at least at first glance. If UK inflation shows an increase (as the market currently expects), there will be more reasons for the British currency to start a new uptrend. In this case, the BoE will not rush into a second rate cut.
We have mentioned in previous articles that the British central bank is quite concerned about service sector inflation and core inflation. Therefore, if core inflation also rises, it will lead to a pause in monetary policy easing.
With U.S. inflation, it's the opposite. Even a slight slowdown (within the forecast) can trigger the dollar's decline, as has happened several times in recent months. The market will increasingly believe that the Fed will lower the key rate in September, regardless of whether it happens or not. Thus, these two reports will determine the pair's movement this week. Unfortunately, it is impossible to predict the values of these reports in advance. Therefore, it's also pointless to forecast where the pair will be trading by the end of the week.
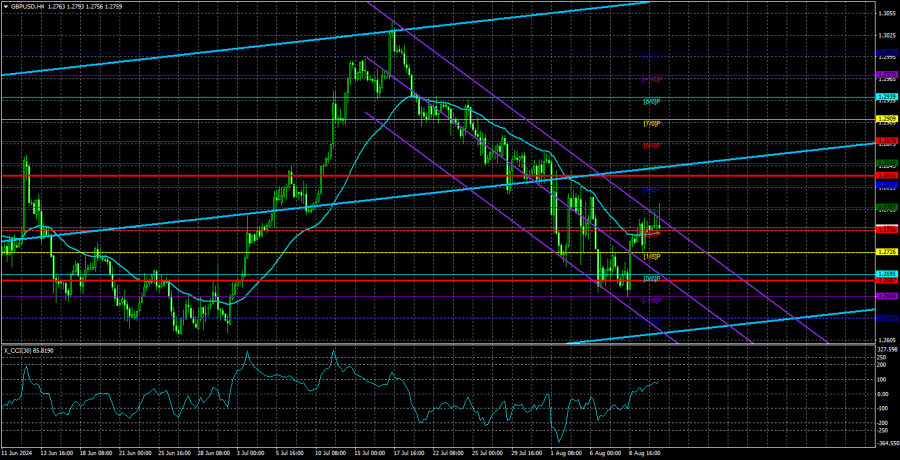
We expect a sustained decline from the British currency in the medium term because we still consider it overbought and unjustifiably expensive. In the 24-hour time frame, the price continues to trade below the critical line, but all the downward movement of recent weeks falls under the category of a "correction," just like the entire upward movement over the past year.
Politics has taken a back seat. The media already awarded Donald Trump the election victory, then Joe Biden decided not to run, and the keys to the White House were handed to Kamala Harris. Here, as with the issue of rates, everyone has their own forecast. Trading based on this information is pointless.

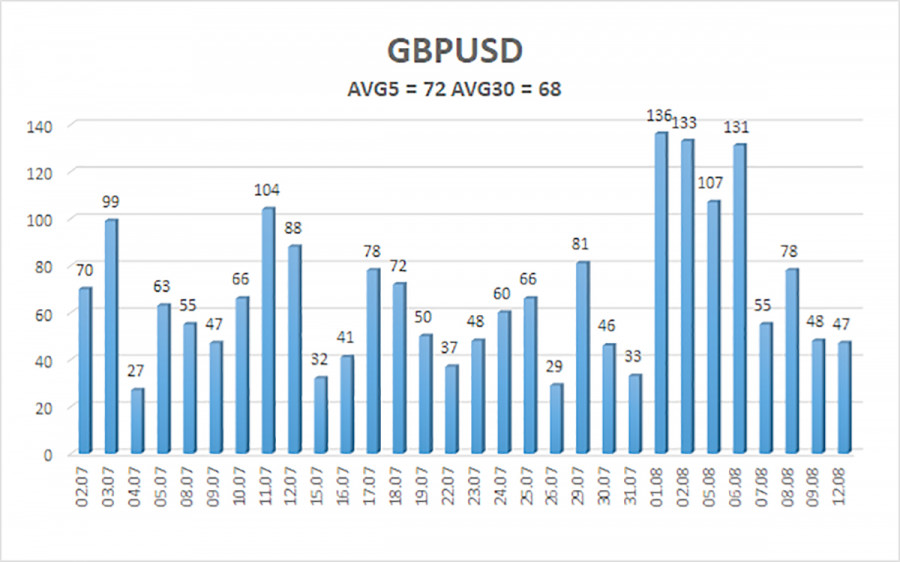
The average volatility of GBP/USD over the last five trading days is 72 pips. This is considered an average value for the pair. Therefore, on Tuesday, August 13, we expect movement within the range limited by 1.2687 and 1.2831. The upper channel of the linear regression is directed upward, indicating that the uptrend remains intact. The CCI indicator has formed an oversold condition and a bullish divergence. A correction has already begun and may continue this week.
Nearest Support Levels:
- S1 – 1.2756
- S2 – 1.2726
- S3 – 1.2695
Nearest Resistance Levels:
- R1 – 1.2787
- R2 – 1.2817
- R3 – 1.2848
Trading Recommendations:
The GBP/USD pair continues to hover around the moving average line and has a good chance of sustaining the bearish momentum. We are not considering long positions at this time, as we believe that the market has already processed all the bullish factors for the British currency (which are not much) multiple times. Short positions could be considered at least after the price settles below the moving average. The British pound may continue to correct upward this week, as indicated by the CCI indicator, but whether to act on the correction is up to the traders to decide. The pound will have a good chance to show growth after the U.S. and the UK inflation reports.
Explanations for Illustrations:
Linear Regression Channels: help determine the current trend. If both are directed in the same direction, it means the trend is strong.
Moving Average Line (settings 20,0, smoothed): determines the short-term trend and the direction in which trading should be conducted.
Murray Levels: target levels for movements and corrections.
Volatility Levels (red lines): the probable price channel in which the pair will spend the next 24 hours, based on current volatility indicators.
CCI Indicator: Entering the oversold area (below 250) or the overbought area (above +250) means a trend reversal is approaching.
The material has been provided by InstaForex Company - www.instaforex.com #


 Download NOW!
No comments:
Post a Comment