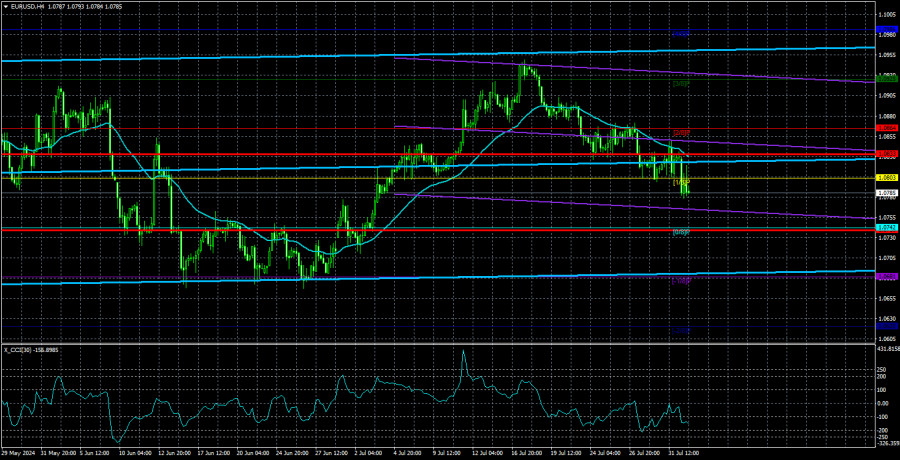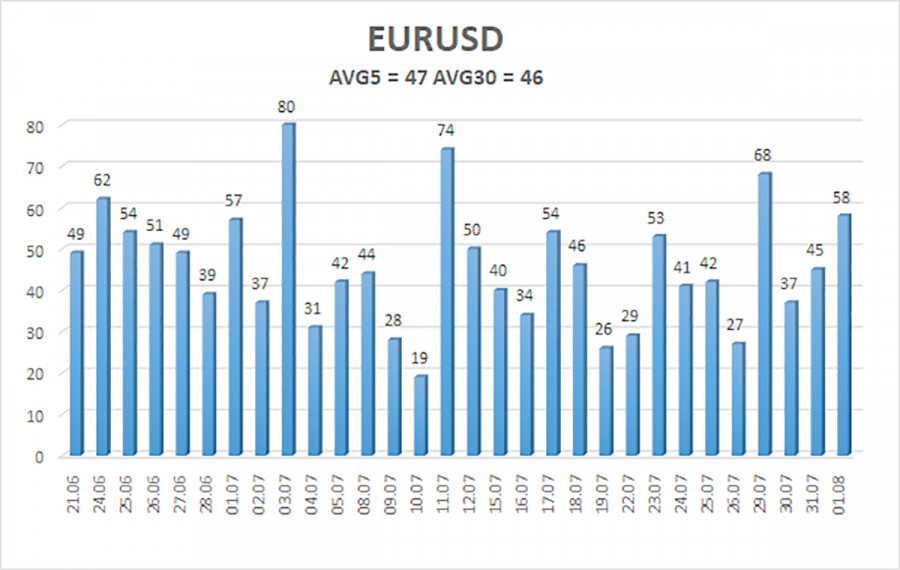
EUR/USD sustained its weak decline throughout Thursday. Some might think, looking at the charts, that the price plummeted several times on Wednesday and Thursday. However, in reality, volatility remains at a very low level. Nothing seems to help: neither macroeconomic data nor fundamental events such as central bank meetings. Therefore, the first thing to understand is that the market still wants to refrain from actively trading.
We've been talking about this for a long time. If the pair moves 40 pips daily, expecting a 100-pip move on any event is foolish. And even if such a move occurs, it will be an exception to the rule. In yesterday's article, we deliberately did not discuss the results of the Federal Reserve meeting, although, in essence, there was nothing to discuss. As expected, the key rate remained unchanged, and Fed Chair Jerome Powell's speech could be interpreted in any direction. However, we can note an increase in dovish rhetoric from the Fed head. Powell mentioned that the central bank might lower the key rate in September. He did not say that the Fed would lower it but that it might lower it. The Fed could just as easily lower the rate later this year or could have reduced it in July. However, such phrases were absent from his previous speeches.
We still believe that inflation does not yet allow the Fed to consider lowering rates. Powell noted that inflation slowed in the second quarter, giving confidence in this indicator moving towards 2%. Powell also mentioned the PCE index, which stood at 2.6% at the end of the second quarter. He also noted the core PCE, which was 2.9%. In his view, these indicators are very important but not the only ones considered when making monetary policy decisions.
Powell also indicated that monetary policy will remain restrictive for some time, but rates may begin to decrease. The current rate level is much higher than the "neutral" level, so even several stages of easing will maintain a "restrictive" policy. From everything Powell said, it can be concluded that the Fed is approaching its first rate cut. We do not believe it will happen in September, but the market is 100% confident. So why did the dollar rise yesterday and today?
It's simple—the horizontal channel on the 24-hour TF. We've been saying for several weeks that the price has been trading between 1.0600 and 1.1000 levels since the beginning of the year, and the fundamental and macroeconomic background only has a local impact on the pair's movement. And even then, not always. For several weeks, we observed an illogical rise in the euro, and now we can and will likely observe the same illogical rise in the dollar. We also mentioned that the market has anticipated the first Fed rate cut "in advance" for 7-8 months. Recall that initially, everyone expected rate cuts back in March. Therefore, we do not expect further growth from the EUR/USD pair. First, we expect it to fall to around the 1.0600 level or so.

The average volatility of the EUR/USD pair over the past five trading days as of August 2 is 47 pips, which is considered low. We expect the pair to move between the levels of 1.0739 and 1.0833 on Friday. The higher linear regression channel is directed upwards, but the global downward trend persists. The CCI indicator entered the overbought area, a warning of a trend direction change.
Nearest Support Levels:
- S1 – 1.0742
- S2 – 1.0681
- S3 – 1.0620
Nearest Resistance Levels:
- R1 – 1.0803
- R2 – 1.0864
- R3 – 1.0925
Trading Recommendations:
The EUR/USD pair maintains a global downward trend; a weak decline continues in the 4-hour time frame. In previous reviews, we mentioned that we are only expecting the continuation of the global downward trend. We do not believe the euro can start a new global trend amid the European Central Bank's monetary policy easing, so the pair will likely fluctuate between 1.0600 and 1.1000 for some time. Since the price has reversed in the upper part of this range, short positions with targets around the Murray level "-1/8" - 1.0681 remain valid.
Explanations for Illustrations:
Linear Regression Channels: help determine the current trend. If both are directed in the same direction, it means the trend is strong.
Moving Average Line (settings 20,0, smoothed): determines the short-term trend and the direction in which trading should be conducted.
Murray Levels: target levels for movements and corrections.
Volatility Levels (red lines): the probable price channel in which the pair will spend the next 24 hours, based on current volatility indicators.
CCI Indicator: Entering the oversold area (below 250) or the overbought area (above +250) means a trend reversal is approaching.
The material has been provided by InstaForex Company - www.instaforex.com #


 Download NOW!
No comments:
Post a Comment