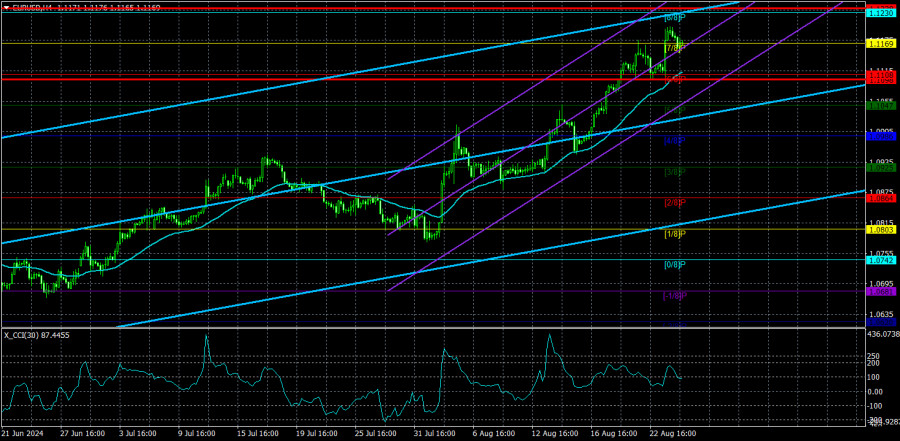
On Monday, the EUR/USD pair seemed unsure of its next move. The euro has been rising almost continuously since June 27 and non-stop since August 2. During this time, the market has been reacting in one direction only. At the beginning of the month, new weak (relative to forecasts) data on the US labor market and unemployment were published, which explains why the market sells the dollar on such days. But how do we explain the three-week decline of the dollar? Yes, the likelihood of a Federal Reserve rate cut in September is already reaching 100%, but hasn't the market already been pricing in such a rate cut since the beginning of the year and even since 2022, when inflation began to slow down in the US? Look closely at the daily and weekly time frames – the dollar started falling a month or two after inflation began to slow down in America.
Thus, we still cannot call the current movement a logical one. We expected it to stop in the first half of the year, but as we can see, the market continues to work out the future easing of the Fed's monetary policy in advance. The only question is, how many rate cuts has the market already factored in? Considering the dollar's decline over the past two years, it seems the market has priced in about eight or nine rate cuts.
Under the current circumstances, we can make the following assumptions. At a certain point, the dollar's decline due to expectations was logical. We have repeatedly stated that the market always tries to factor in important future events in advance. However, there is also the opposite side of the coin. When the event actually happens, there is a counter-reaction because it has already been priced in. Therefore, we expect the US currency to strengthen in any case. And, as before, it is expected to be strong. Moreover, this could start happening soon. Remember when the dollar began to fall? It was a couple of months after the first signs of slowing inflation. If the Fed begins lowering rates in September, the dollar may start to catch up quickly.
It is clear to everyone that you cannot price in monetary easing in the US while ignoring easing in the Eurozone. The European Central Bank has already begun lowering rates and may cut them again in September. Thus, the euro itself has no grounds to rise so confidently. If we are wrong and the dollar continues to rise for another 3-6-9 months, we must admit that the fundamental background does not matter. What is the point of studying monetary policy if the market trades as it pleases?
The CCI indicator does not want to enter overbought territory, although we haven't seen even a small correction since the last two instances. In general, the situation is illogical now. We cannot predict further growth of the euro, but it could very well continue since the market does nothing but sell the dollar.

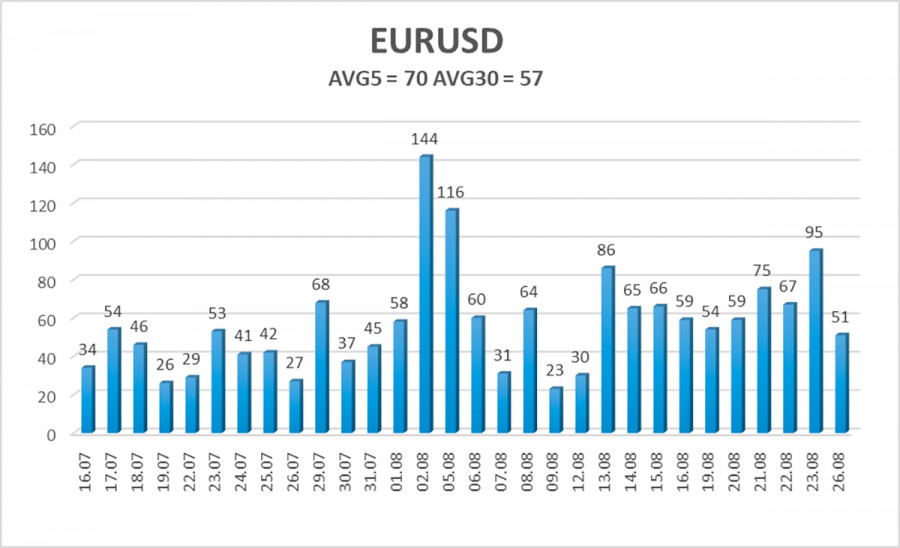
The average volatility of EUR/USD over the past five trading days as of August 27 is 70 pips, which is considered average. We expect the pair to move between the levels of 1.1098 and 1.1238 on Tuesday. The upper channel of the linear regression is directed upwards, but the global downward trend persists. The CCI indicator entered the overbought area three times, warning not only of a possible trend reversal to the downside but also of how the current rise is illogical.
Nearest Support Levels:
- S1 – 1.1169
- S2 – 1.1108
- S3 – 1.1047
Nearest Resistance Levels:
- R1 – 1.1230
- R2 – 1.1292
- R3 – 1.1353
Trading Recommendations:
The EUR/USD pair continues its strong and uninterrupted upward movement due to the market's relentless desire to buy euros and sell dollars continuously. In previous reviews, we mentioned that we only expect declines from the euro in the medium term, but the current rise now seems almost like a mockery. However, it would be foolish to deny that the price is in an upward movement, and there are no signs of its end yet. The market continues to seize every opportunity to buy, but the technical picture warns of a high probability of an upward trend ending. Short positions may be considered after the pair consolidates below the moving average, with targets at 1.1047 and 1.0986.
Explanations for Illustrations:
Regression Channels: help determine the current trend. If both are directed in the same direction, it means the trend is strong at the moment.
Moving Average Line (settings 20,0, smoothed): defines the short-term trend and the direction in which trading should be conducted.
Murray Levels: target levels for movements and corrections.
Volatility Levels (red lines): the probable price channel in which the pair will spend the next 24 hours, based on current volatility indicators.
CCI Indicator: Entering the oversold area (below -250) or the overbought area (above +250) means a trend reversal in the opposite direction is approaching.
The material has been provided by InstaForex Company - www.instaforex.com #


 Download NOW!
No comments:
Post a Comment