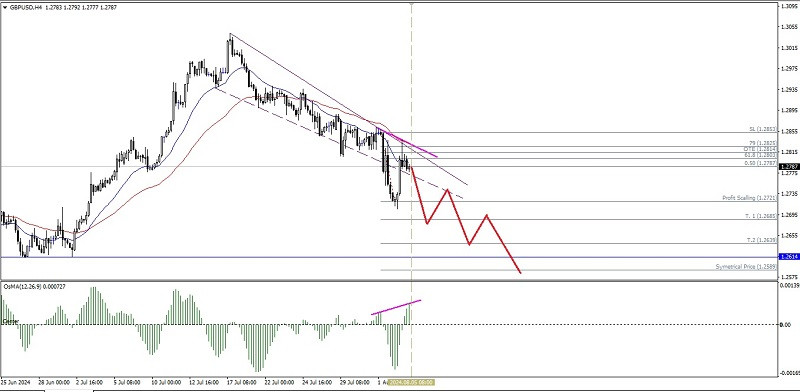
If we look at the 4-hour chart, the main currency pair GBP/USD looks weak where from the technical analysis side we find that the price movement is moving below the EMA 20 & EMA 50 where the position of the EMA 20 is below the EMA 50 which indicates that the Cable condition is under pressure. This is also confirmed by the appearance of hidden deviations between the GBP/USD price movement which makes a Higher Low while the MACD Histogram indicator actually forms a Higher High so that based on all this information in the near future GBP/USD has the potential to weaken down where the level of 1.2721 will be tested again by Cable if this level is successfully broken below then GBP/USD will go to the level of 1.2639 and if volatility and momentum support then GBP/USD will go to the level of 1.2589 but please note that the emergence of the failing Wedge pattern has the potential to bring GBP/USD to strengthen upward correction especially if it breaks above the level of 1.2853 then all the weakening scenarios that have been described previously will be invalid and automatically canceled by themselves.
(Disclaimer)
Pentru mai multe detalii, va invitam sa vizitati stirea originala.
(Disclaimer)
Pentru mai multe detalii, va invitam sa vizitati stirea originala.


 Download NOW!
No comments:
Post a Comment