The EUR/USD pair calmly continued its upward movement on Monday. Is it even worth mentioning that there were no significant macroeconomic or fundamental events yesterday? The dollar is simply falling again, and there is no need for any justification. Unless, of course, we count the market's expectations regarding the Federal Reserve's rate decision. Because only this factor currently determines how much the U.S. dollar will be worth tomorrow.
To briefly recap, at the beginning of August, market expectations for a 50-point easing of the Fed's monetary policy in September sharply increased. It's worth noting that not a single member of the Fed's monetary committee ever explicitly mentioned the possibility of a half-percentage-point rate cut. Yes, some hinted indirectly that this was possible, but no one ever said it outright. Moreover, no Fed official ever stated that rates would be lowered six times in 2024. The market came up with this scenario at the beginning of the year and has been trading on that expectation since. Now it's September, and the Fed may cut rates no more than three times by the end of the year. So, what should the market do, having spent the entire year selling the dollar? That's right! Expect three 50-point cuts all at once.
Let's go back to August. After another less-than-stellar NonFarm Payrolls report and rising unemployment, the market convinced itself that the US economy was in bad shape, and the Fed now needed to focus on the labor market rather than inflation. Naturally, this led to a new round of dollar sell-offs because "the Fed will definitely cut the rate by 0.5%." By mid-August, it became clear that the market had once again been too quick with its dovish expectations, but by early September, the expectations for aggressive easing once again dominated the market. In other words, the market swings back and forth on its own, changing its expectations and acting on them, while the Fed has yet to lower the key rate even once. And we have serious doubts that it will reduce the rate by 0.5% on Wednesday.
However, it doesn't matter to market participants how much the Fed will lower the rate. They are trading based on their expectations. Suppose the rate is reduced by 0.25%. So what? Then, we can expect two rounds of easing by 0.75% at the remaining two meetings. Does that sound unrealistic? It's no more unrealistic than three 0.5% or six 0.25% cuts. The major players solely focus on selling the US dollar, so they don't need any grounds or reasons for doing so. As a result, the dollar continues to fall despite the technical picture and the fundamental and macroeconomic backgrounds and can't even properly correct. Well, we keep watching. The year 2024 might end up in textbooks to show novice traders how the price can completely ignore all factors and types of analysis.

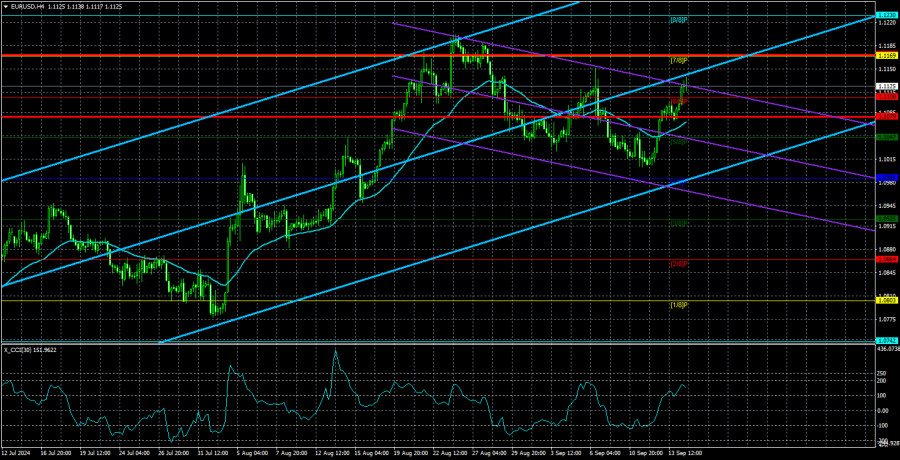
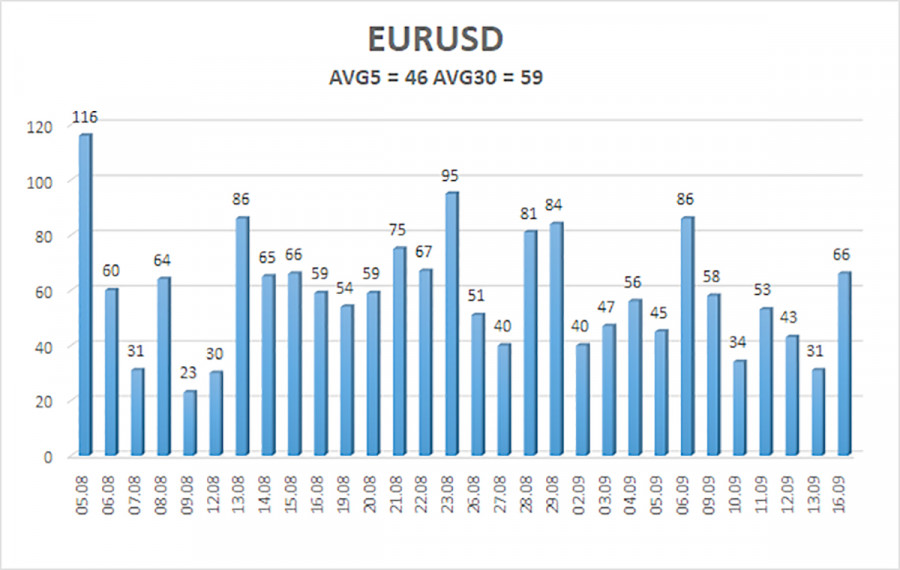
The average volatility of EUR/USD over the past five trading days as of September 117 is 46 pips, which is considered "moderately low." We expect the pair to move between levels of 1.1079 and 1.1171 on Tuesday. The upper linear regression channel points upward, but the global downtrend persists. The CCI indicator entered the overbought area three times, signaling a potential shift to a downtrend and how the recent rise is illogical. However, for now, we only see a relatively mild correction.
Nearest Support Levels:
- S1 – 1.1108
- S2 – 1.1047
- S3 – 1.0986
Nearest Resistance Levels:
- R1 – 1.1169
- R2 – 1.1230
- R3 – 1.1292
Trading Recommendations:
The EUR/USD pair shows weak downward movement with frequent pullbacks. In previous reviews, we mentioned that we expect the euro to decline in the medium term, as any new upward movement would seem absurd. There is a possibility that the market has already priced in all future rate cuts by the Fed. If so, the dollar has no further reason to fall. Short positions can be considered as long as the price remains below the moving average, with targets at 1.0986 and 1.0925. U.S. macroeconomic data undermine the dollar, and the market is still reluctant to buy it.
Explanations for Illustrations:
Linear Regression Channels: help determine the current trend. If both are pointed in the same direction, this indicates a strong trend.
Moving Average Line (settings 20,0, smoothed): defines the short-term trend and the direction in which trading should be conducted.
Murray Levels: target levels for movements and corrections.
Volatility Levels (red lines): the probable price channel in which the pair will spend the next 24 hours, based on current volatility indicators.
CCI Indicator: Entry into the oversold area (below -250) or the overbought area (above +250) indicates an impending trend reversal in the opposite direction is approaching.
The material has been provided by InstaForex Company - www.instaforex.com #


 Download NOW!
No comments:
Post a Comment