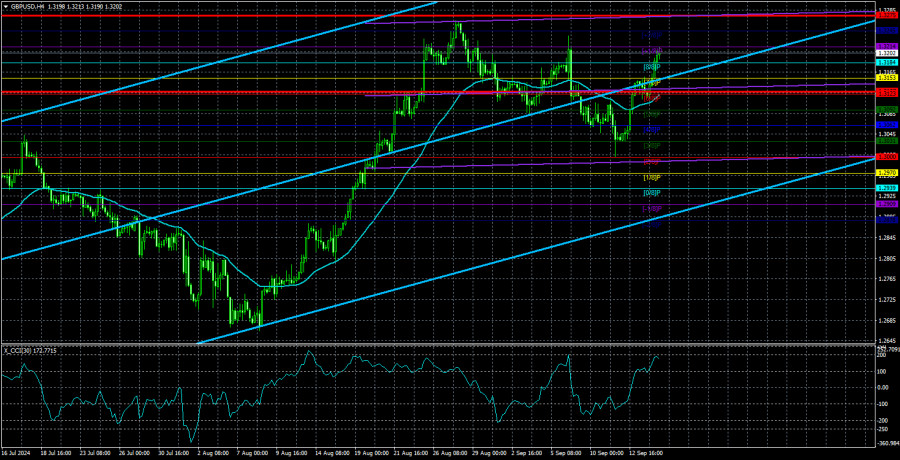
The GBP/USD pair also surged on Monday. While the euro might have appreciated based on market expectations surrounding the Federal Reserve's rate decision, the pound had even more reasons to rise. After all, the Bank of England's meeting is on Thursday, where it's unlikely that monetary policy will be eased. What better reason to buy the pound? Thus, the pound sterling is rising again, seemingly out of nowhere.
We want to remind you that the market can price in global events and processes in advance. "Buy on rumors, sell on facts." However, the second part of this rule seems to have stopped working lately. For instance, the BoE started lowering rates, and what happened? The pound sterling kept rising. The Fed will begin easing on September 18—tomorrow, in fact. Does anyone really believe that the dollar will start a prolonged rally on September 19?
We believe—or rather, we want to believe in this. Otherwise, the last remnants of logic will disappear. We'll be left with a scenario where the dollar falls under any circumstances, and the market invents new reasons to sell the US currency. For nine months straight, we've been listening to the "comedy" called the "American recession." The US economy posts stronger-than-expected growth every quarter, and this growth is measured in percentages, not tenths of a percent, like in Britain or the Eurozone. Yet somehow, everything is only bad in the US, while the "British and European economies are recovering." Last week, European Central Bank President Christine Lagarde stated that GDP forecasts had been revised downward (and they were already modest), but the euro continues to rise, as it has been. And along with it, so does the pound.
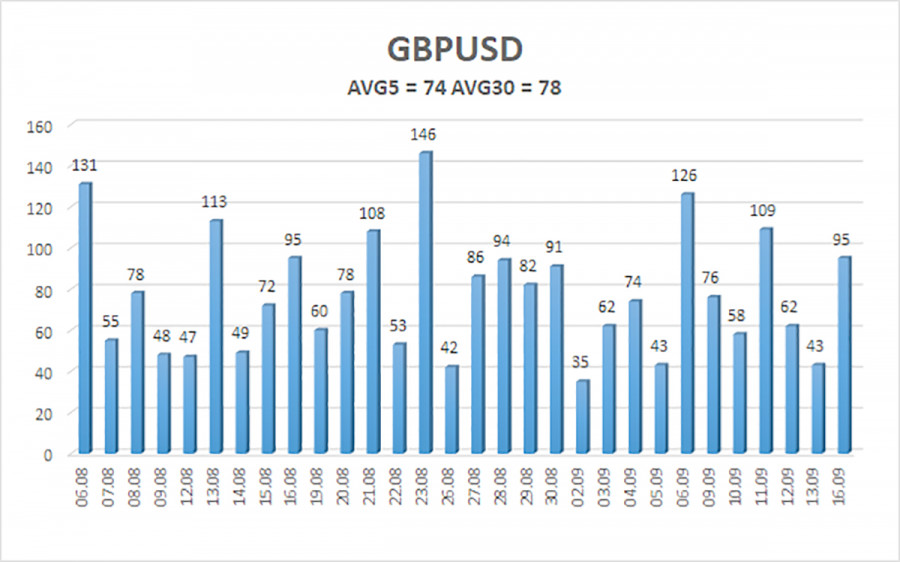
Thus, it doesn't matter what decision the BoE makes or how many members of the monetary committee vote for a rate cut. So, the pound might fall locally by 50 pips—what difference will that make? Even traders who believe the current movement is justified can again see its illogical nature. It's Monday, no news, data, or reports—and the pound is rising by 100 pips in the first 12 hours. If we look at the illustration below, we can see that the pair doesn't always cover 100 pips in a day. In the last 30 days, it managed to show volatility above 100 pips only seven times. But, of course, the pound's growth is logical and natural. This is probably due to "rising risk sentiment."
We expect only the end of this illogical rise because opening positions when you don't understand why the pair is moving in that direction is foolish. Of course, if any trader is trading based purely on technical analysis, then going long is precisely what's needed right now. By Friday, we will have a clearer understanding of what to expect from the US dollar. If it continues to fall as it did on Monday, expecting logic from the market now would be like expecting the Liechtenstein national team to win over the Brazilian team.

The average volatility of the GBP/USD pair over the past five trading days is 74 pips, which is considered average for this pair. Therefore, on Tuesday, September 17, we expect movement within a range limited by the levels of 1.3127 and 1.3275. The upper linear regression channel is directed upwards, indicating that the upward trend remains intact. The CCI indicator has formed four bearish divergences, which suggest a substantial decline, yet we still don't see it.
Nearest Support Levels:
- S1 – 1.3184
- S2 – 1.3153
- S3 – 1.3123
Nearest Resistance Levels:
- R1 – 1.3214
- R2 – 1.3245
Trading Recommendations:
The GBP/USD pair has taken the first step towards a downtrend, and we hope this won't be the only one. We are not considering long positions now, as we believe that the market has repeatedly factored in all the bullish factors for the British currency (which are not much). However, it is hard to deny that the pound could continue to rise. Therefore, if you're trading based solely on technical analysis, long positions with targets of 1.3245 and 1.3275 are possible. Short positions can be considered with targets at 1.2939 and 1.2878 if the price consolidates below the moving average. However, the market may still resume pricing in the future easing of the Fed's monetary policy. Caution is advised.
Explanations for Illustrations:
Linear Regression Channels: help determine the current trend. If both are pointed in the same direction, this indicates a strong trend.
Moving Average Line (settings 20,0, smoothed): defines the short-term trend and the direction in which trading should be conducted.
Murray Levels: target levels for movements and corrections.
Volatility Levels (red lines): the probable price channel in which the pair will spend the next 24 hours, based on current volatility indicators.
CCI Indicator: Entry into the oversold area (below -250) or the overbought area (above +250) indicates an impending trend reversal in the opposite direction is approaching.
The material has been provided by InstaForex Company - www.instaforex.com #


 Download NOW!
No comments:
Post a Comment