Analysis of EUR/USD 5M

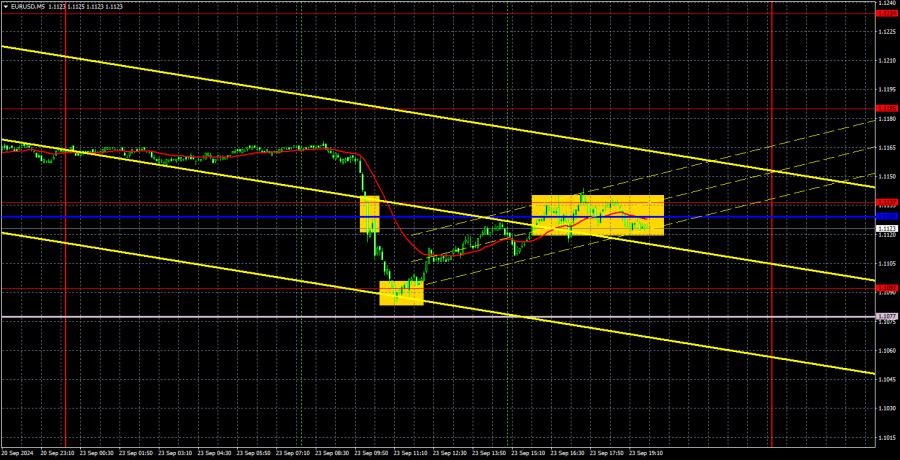
The EUR/USD pair started the new week quite promisingly. If we overlook that the euro began to fall an hour before the release of weak Eurozone data, everything turned out quite well. We didn't expect a slight downward deviation in Germany's and the EU's business activity indices to provoke such a strong reaction. However, let's not forget that this might be a simple manipulation by market makers. The price failed to test its last local low or consolidate below the Senkou Span B line. Therefore, we only saw another routine correction that didn't affect the overall market sentiment or trend. We believe such a strong market reaction occurred because all four business activity indices were weaker than expected.
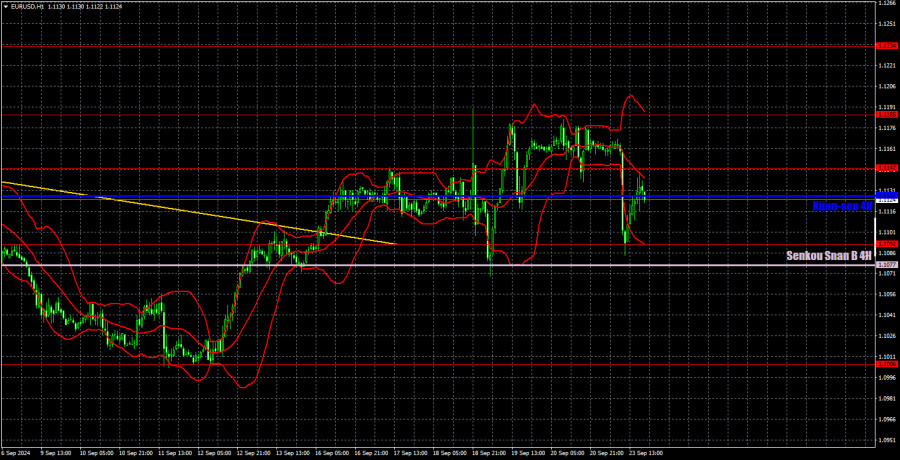
Nothing changes on the hourly time frame. The pair remains in an ascending channel after a relatively small downward correction. Over the past week, it has traded exclusively between the levels of 1.1092 and 1.1185. Thus, a horizontal channel has formed at the highs. Let's recall that in 2024, the market tends to reach a certain height and then move into a flat phase, which can last for a week or even a month. The fact remains – the dollar still can't show growth. And when a miracle happens, this growth doesn't have a significant impact.
On Monday, two trading signals were formed. First, the pair broke through the 1.1129-1.1137 area, then tested and rebounded from the 1.1092 level. A short position could be opened in the first case and a long one in the second. It was possible to earn 30-40 pips on these two trades.
COT report:

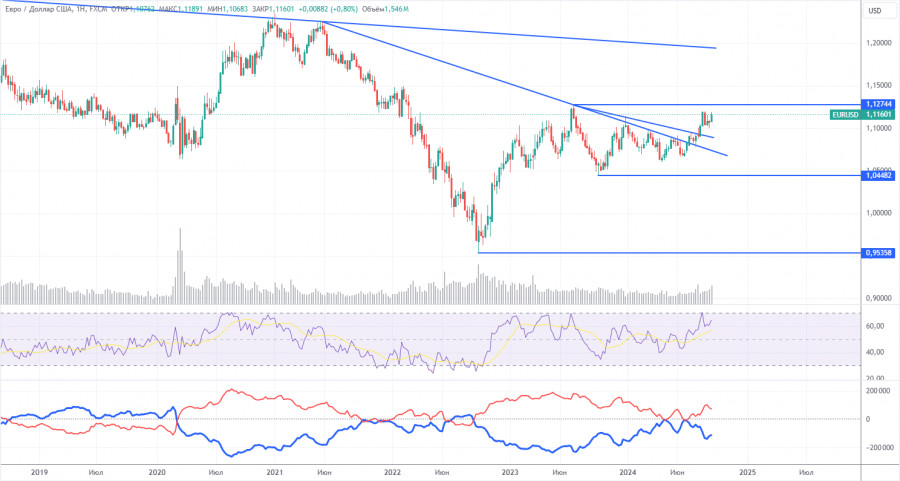
The latest COT report is dated September 17. The illustration above clearly shows that the net position of non-commercial traders has remained bullish for a long time. The bears' attempt to gain dominance ended in complete failure. The net position of non-commercial traders (red line) declined in the second half of 2023 and early 2024, while commercial traders (blue line) increased. Currently, professional players are again increasing their long positions.
We also still do not see any fundamental factors supporting the strengthening of the euro. Technical analysis indicates that the price is in a consolidation phase—in other words, a flat trend. In the weekly time frame, it is clear that since December 2022, the pair has been trading between levels 1.0448 and 1.1274. In other words, we have moved from a seven-month flat into an 18-month one.
The red and blue lines are moving further apart, indicating that long positions on the euro have increased. However, such changes cannot be a basis for long-term conclusions within a flat trend. During the last reporting week, the number of long positions in the non-commercial group decreased by 10,500, while the number of short positions increased by 1,200. Accordingly, the net position decreased by 11,700. The euro still has the potential to fall.
Analysis of EUR/USD 1H

In the hourly time frame, the pair has real chances to end the baseless upward trend, but these chances continue to fade before our eyes. The trendline has been breached along with the Senkou Span B line. Now, the more global upward trend will likely resume. There's no point in talking about fundamental and macroeconomic grounds for a new decline in the dollar – they don't exist. To be more precise, the market only 'sees' the news that tells it to sell the dollar. Corrections occur occasionally, but this does not change the fact that the euro is rising without solid justification.
For September 23, we highlight the following levels: 1.0658-1.0669, 1.0757, 1.0797, 1.0843, 1.0889, 1.0935, 1.1006, 1.1092, 1.1147, 1.1185, 1.1234, 1.1274, as well as the Senkou Span B line (1.1077) and Kijun-sen (1.1127). The Ichimoku indicator lines can move during the day, so this should be considered when identifying trading signals. Remember to set a Stop Loss to break even if the price has moved in the intended direction by 15 pips. This will protect you against potential losses if the signal turns out to be false.
On Tuesday, the Eurozone and the US will not have a macroeconomic or fundamental background. Therefore, intraday volatility will likely be low, and the pair should remain within the horizontal channel of 1.1092-1.1185.
Explanation of Illustrations:
Support and resistance levels: Thick red lines near which the trend may end. They are not sources of trading signals.
Kijun-sen and Senkou Span B lines: These Ichimoku indicator lines, transferred from the 4-hour timeframe to the hourly chart, are strong lines.
Extreme levels: Thin red lines from which the price previously bounced. These provide trading signals.
Yellow lines: Trend lines, trend channels, and other technical patterns.
Indicator 1 on COT charts: The net position size for each category of traders.
The material has been provided by InstaForex Company - www.instaforex.com #


 Download NOW!
No comments:
Post a Comment