Analysis of GBP/USD 5M

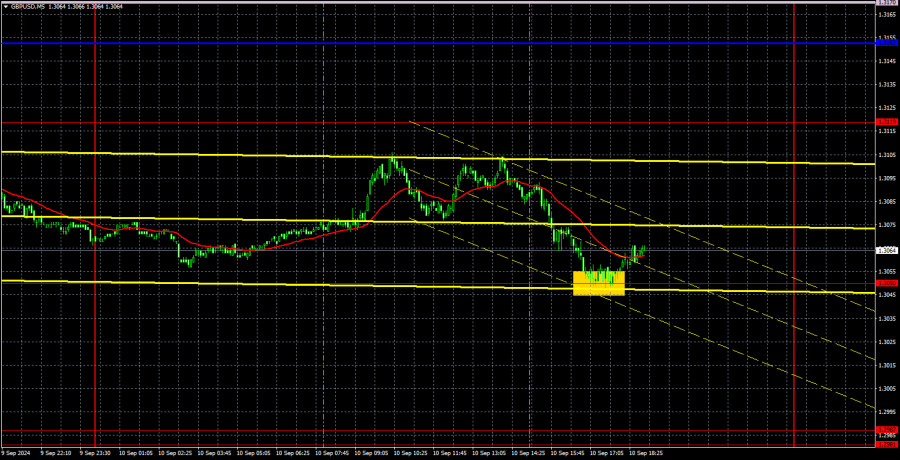
The GBP/USD pair traded both up and down on Tuesday. In the first half of the day, the British currency rose, driven by positive macroeconomic data from the UK. In the second half of the day, the market returned to the general downward trend formed over the past two weeks. By the end of the day, the price reached the 1.3050 level, but it failed to break through it.
Yesterday, the UK released reports on wages, unemployment, and the number of unemployed. The first report showed a more significant slowdown than expected. The second aligned with forecasts, while the third significantly exceeded expectations. Thus, in general, this set of data can be considered positive for the pound, which is why it rose during the European trading session. However, the downward correction of the pound is still very weak. We still expect a continuation of the decline, but it may not start immediately. The market is still in the state of "sell the dollar at any convenient opportunity." In the U.S., such an opportunity may present itself if the Consumer Price Index shows a more significant slowdown than the market expects. This could trigger another round of speculation around the Federal Reserve's rate, which might be cut by 0.5% on September 18 or something like that. Therefore, the dollar remains in a very precarious position.
There was only one trading signal on Tuesday. In the middle of the U.S. trading session, the price bounced off the 1.3050 level, but it was quite late to enter the market. A long position could have been opened by setting a Stop Loss below the 1.3050 level, but today, the U.S. inflation report will be released, and the pair could move sharply in either direction.
COT report:

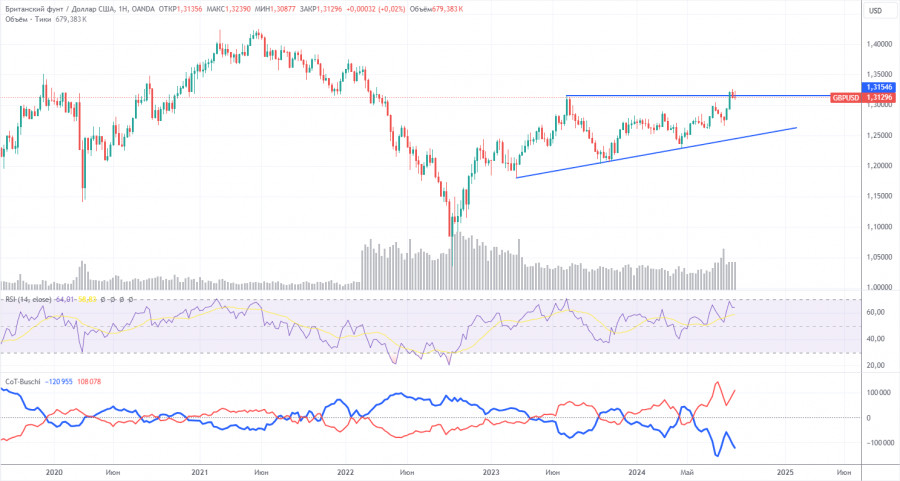
The COT reports for the British pound show that the sentiment of commercial traders has been subject to frequent changes in recent years. The red and blue lines, representing the net positions of commercial and non-commercial traders, constantly intersect and are mainly close to the zero mark. We also see that the last downward trend occurred when the red line was below zero. Therefore, a downturn could be expected around the level of 1.3154, but this assumption will need regular confirmation over time.
According to the latest report on the British pound, the non-commercial group opened 8,600 buy contracts and closed 9,500 short ones. This led to a significant increase in the net position of non-commercial traders by another 18,100 contracts over the week, and overall, it continues to grow.
The fundamental background still does not provide any grounds for long-term purchases of the pound sterling, and the currency has a real chance to resume the global downtrend. However, an ascending trend line formed in the weekly time frame. Therefore, a long-term decline in the pound is unlikely unless the price breaches this trend line. Despite almost everything, the pound continues to rise. Even when COT reports show that major players are selling the pound, it continues to increase.
Analysis of GBP/USD 1H

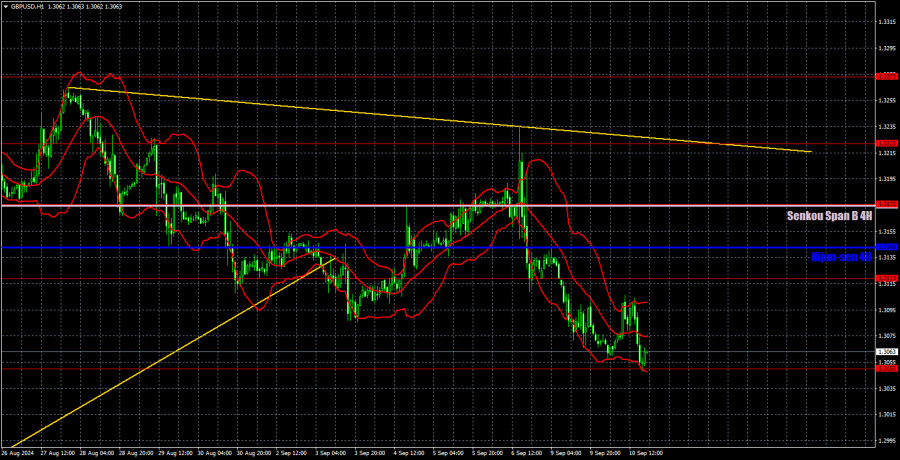
In the hourly time frame, GBP/USD continues to correct, but this correction could end at any moment. It may have ended since the price couldn't stay below the Senkou Span B line. This line itself has settled above the price. Most of the U.S. macroeconomic data last week was weak as usual, reducing the market's desire to buy the dollar. The pair continues to move sluggishly, but this could persist for quite some time.
For September 11, we highlight the following key levels: 1.2605-1.2620, 1.2691-1.2701, 1.2796-1.2816, 1.2863, 1.2981-1.2987, 1.3050, 1.3119, 1.3175, 1.3222, 1.3273, 1.3367. The Senkou Span B (1.3174) and Kijun-sen (1.3143) lines can also serve as sources of signals. Setting the Stop Loss to break even when the price moves in the intended direction by 20 pips is recommended. The Ichimoku indicator lines may shift during the day, which should be considered when determining trading signals.
On Wednesday, the UK is scheduled to release the monthly and three-month GDP reports and industrial production data. In terms of significance, these are similar to the reports from yesterday. They may provoke a local market reaction, but nothing more. In the U.S., the "event of the week" will be the August inflation report, directly influencing the Fed's decision on September 18.
Explanation of illustrations:
Support and resistance levels: Thick red lines near which the trend may end.
Kijun-sen and Senkou Span B lines: These Ichimoku indicator lines, transferred from the 4-hour timeframe to the hourly chart, are strong lines.
Extreme levels: Thin red lines from which the price previously bounced. These provide trading signals.
Yellow lines: Trend lines, trend channels, and other technical patterns.
Indicator 1 on COT charts: The net position size for each category of traders.
The material has been provided by InstaForex Company - www.instaforex.com #


 Download NOW!
No comments:
Post a Comment