EUR/USD 5-Minute Analysis

The EUR/USD pair continued its steady decline on Monday, despite no macroeconomic or fundamental events in either the U.S. or the EU. As we've repeatedly stated, the dollar is undervalued, while the euro is overbought. Throughout 2024, the market has been pricing in the expected easing of the Federal Reserve's monetary policy.
These recurring themes continue to push the pair lower and the dollar higher, a trend that has persisted for a month and a half. Factors like the U.S. elections, potential inflationary policies under Trump, and Germany's political crisis have also influenced the dollar's trajectory. However, the euro faced plenty of negative news earlier this year as well. The European Central Bank was also preparing to lower rates, and the EU's economic growth wasn't outpacing the U.S. Unemployment rates in the EU weren't better either.
In reality, the market appears to have driven the euro excessively high, only to trigger mass sell-offs and rebalance its exchange rate to fair levels. We continue to anticipate the euro's decline to the $1.02–$1.04 region, which isn't far away now. Macroeconomic data and fundamental events are unlikely to halt the dollar's rally, especially after two years of undeserved depreciation.
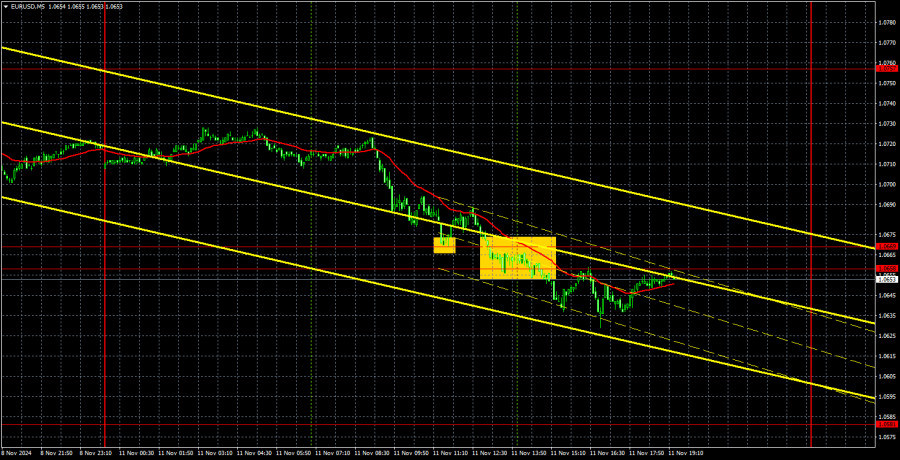
On Monday, trading signals emerged around the 1.0658–1.0669 zone. However, Friday's price action near 1.0757 already set the stage for selling, and Monday's decline continued that signal. The pair could continue its downward trend this week with the price below this area, even without supportive dollar news or events.
COT Report

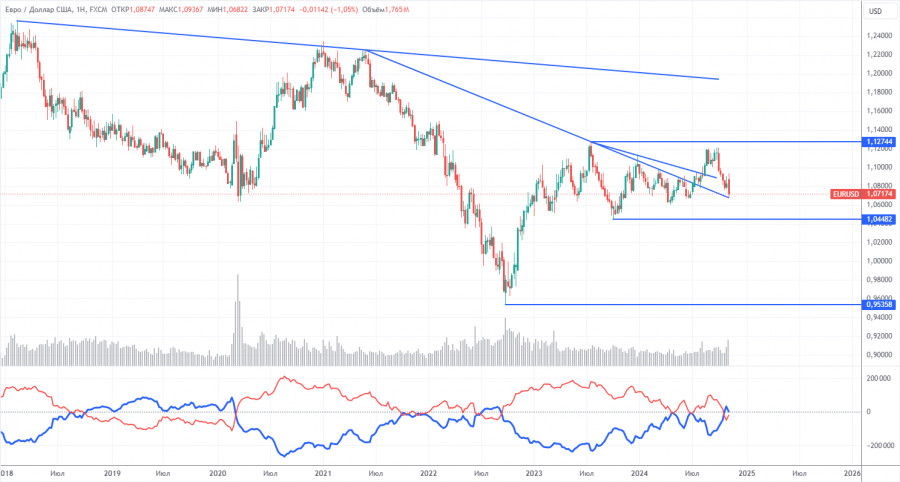
The latest Commitments of Traders (COT) report is dated November 5. The net position of non-commercial traders has long remained bullish, with bears failing to gain dominance. However, three weeks ago, professional traders significantly increased their short positions, turning the net position negative for the first time in a long while. This indicates that the euro is now being sold more frequently than bought.
We still see no fundamental factors supporting the euro's strength, while technical analysis indicates consolidation—a flat market. On the weekly time frame, the pair has been trading between 1.0448 and 1.1274 since December 2022, effectively transitioning from a 7-month to a 20-month range. A move toward 1.0448 remains more likely.
Currently, the red and blue lines have crossed and reversed positions. Over the last reporting week, the number of long positions in the non-commercial group increased by 600, while short positions decreased by 28,000, resulting in a net drop of 27,400. The euro still has strong potential for further declines.
EUR/USD 1-Hour Analysis

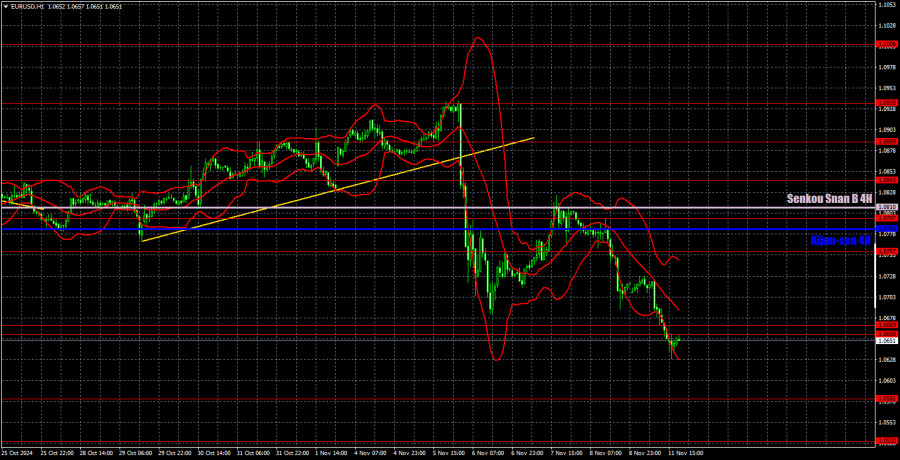
In the hourly time frame, the pair resumed forming a new downtrend. Fundamentally and macroeconomically, there's no strong case for a medium-term dollar decline. In the short-to-medium term, we see no outcome other than the euro's depreciation. With each passing day, it becomes increasingly clear that the market has fully priced in the Federal Reserve's monetary easing cycle. Now, it's responding to other factors favoring a stronger dollar.
For November 12, we highlight the following trading levels: 1.0530, 1.0581, 1.0658-1.0669, 1.0757, 1.0797, 1.0843, 1.0889, 1.0935, and 1.1006, as well as the Senkou Span B (1.0810) and Kijun-sen (1.0784) lines. Ichimoku lines can shift throughout the day, so consider their real-time positions when trading. Always set a Stop Loss at breakeven if the price moves 15 pips in your favor to protect against potential losses from false signals.
Tuesday is another quiet day regarding scheduled events in the EU and the U.S. following Monday's lack of news. Monday demonstrated that the market can continue selling without reports or data. Therefore, we wouldn't be surprised to see the pair decline further and the dollar strengthens today.
Chart Explanations:
Support and resistance levels: thick red lines around which movement may end. They are not sources of trading signals.
Kijun-sen and Senkou Span B lines: Ichimoku indicator lines transferred from the 4-hour to the 1-hour timeframe. These are strong lines.
Extreme levels: thin red lines where the price previously rebounded. They are sources of trading signals.
Yellow lines: Trend lines, trend channels, and other technical patterns.
Indicator 1 on COT charts: The net position size for each category of traders.
The material has been provided by InstaForex Company - www.instaforex.com #


 Download NOW!
No comments:
Post a Comment