GBP/USD 5-Minute Analysis

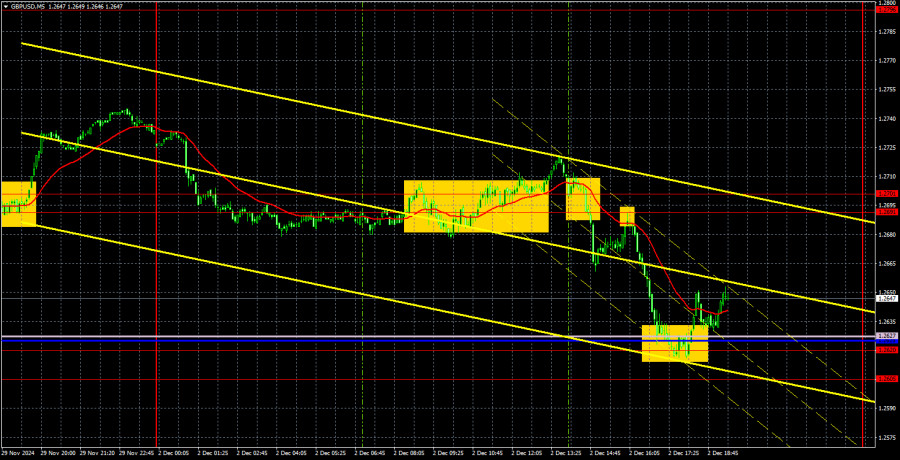
On Monday, the GBP/USD currency pair also demonstrated a downward movement but failed to consolidate below the critical and Senkou Span B line. From a technical perspective, this indicates that the new upward trend on the hourly timeframe remains intact. Macroeconomic or fundamental factors didn't entirely drive the British currency's decline on Monday. The second estimate of the UK Manufacturing PMI was unlikely to garner serious interest, and the ISM Manufacturing PMI was released late in the evening. The pound began its decline overnight at the market's opening. Thus, this week's first round of the bulls-versus-bears battle can be attributed to the bears.
Today's movements are unlikely to be influenced by macroeconomic factors, so the market may once again reveal its directional intentions for the near future. If the dollar continues to strengthen, confidence in the resumption of the downward trend will grow. We maintain our medium-term expectation of the pound's decline, as it remains overbought and unjustifiably expensive.
Several trading signals were formed on Monday, but not all were reliable. Initially, the price lingered near the 1.2691–1.2701 range for an extended period, seemingly unsure of its direction, resulting in two false signals in this area. Later, during the U.S. trading session, two sell signals were generated, which proved valid but redundant to act upon. Overall, the European trading session disrupted the day's potential. A rebound from the Senkou Span B and Kijun-sen lines could have been used to buy the pair, but these signals appeared too late in the session.
COT Report

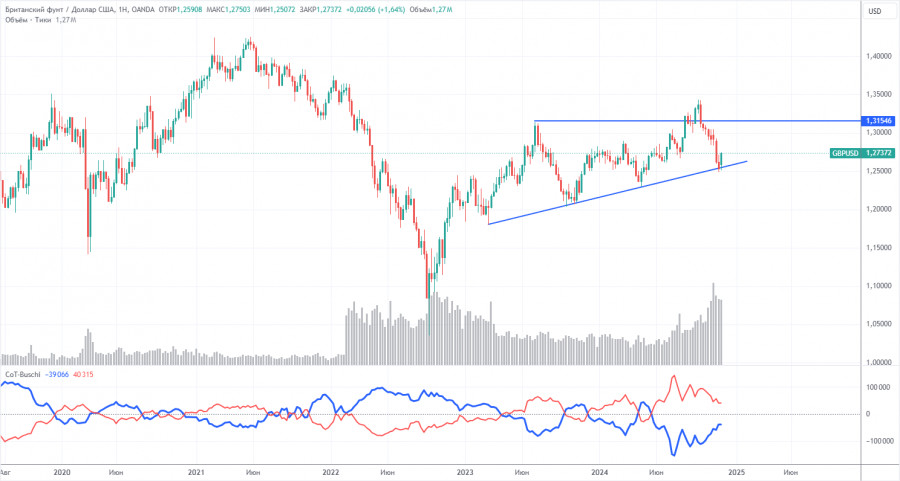
The COT reports for the British pound show that sentiment among commercial traders has frequently shifted in recent years. The red and blue lines, representing the net positions of commercial and non-commercial traders, often cross and mostly remain close to the zero mark. The recent downward trend occurred when the red line was below zero. The red line is above zero, while the price has breached the key 1.3154 level.
According to the latest report on the British pound, the Non-commercial group closed 18,300 BUY contracts and 2,500 SELL contracts. Thus, the net position of Non-commercial traders decreased by another 15,800 contracts during the week.
The fundamental backdrop still does not justify long-term purchases of the British pound, and the currency has a real chance of resuming a global downtrend. On the weekly timeframe, there is an ascending trendline. Until this line is broken, a long-term decline in the pound is unlikely. While the pound has tested this trendline, it hasn't yet consolidated below it. A rebound and correction could occur in the long term, but we believe the line will eventually be breached, and the downtrend will continue.
GBP/USD 1-Hour Analysis

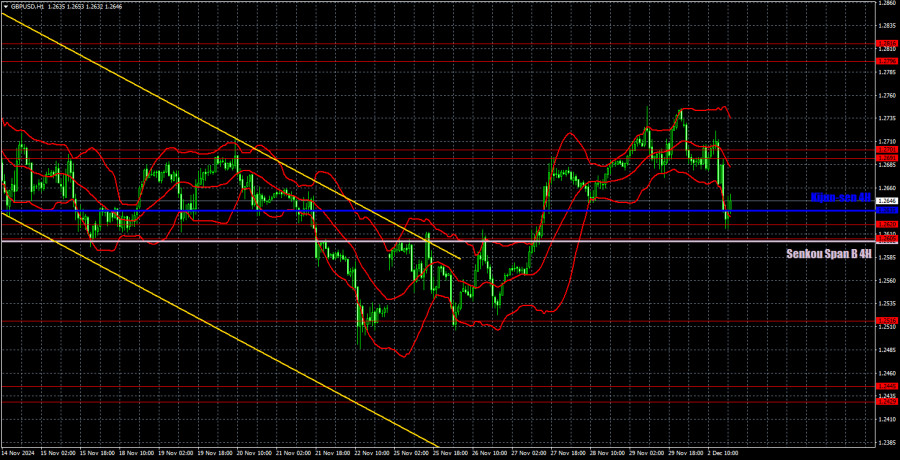
On the hourly timeframe, GBP/USD generally retains its bearish sentiment, so continuing the pound's decline remains the most likely scenario, potentially a strong and prolonged one. The pair has exited the descending channel, but this doesn't guarantee a significant correction. Aside from occasional technical corrections, we continue to see no substantial basis for the pound's growth. A consolidation below the Ichimoku indicator lines could signal a resumption of the downward trend.
For December 3, we highlight the following important levels: 1.2429-1.2445, 1.2516, 1.2605-1.2620, 1.2796-1.2816, 1.2863, 1.2981-1.2987, 1.3050. Senkou Span B (1.2602) and Kijun-sen (1.2635) lines can also be sources of signals. The Ichimoku indicator lines may shift during the day, which should be considered when identifying trading signals. A Stop Loss level is recommended at breakeven once the price moves 20 pips in the correct direction to protect against potential losses from false signals.
There are no significant events or reports scheduled in the UK for Tuesday. In the U.S., the JOLTs report on job openings will be released, but it rarely provokes a strong market reaction. With limited news, we may assess whether the market is ready to continue buying the dollar.
Illustration Explanations:
- Support and Resistance Levels (thick red lines): Key areas where price movement might stall. Not sources of trading signals.
- Kijun-sen and Senkou Span B Lines: Ichimoku indicator lines transferred from the H4 timeframe to the hourly chart, serving as strong levels.
- Extreme Levels (thin red lines): Points where the price has previously rebounded. They can serve as trading signal sources.
- Yellow Lines: Trendlines, channels, or other technical patterns.
- Indicator 1 on COT Charts: Reflects the net position size of each trader category.


 Download NOW!
No comments:
Post a Comment