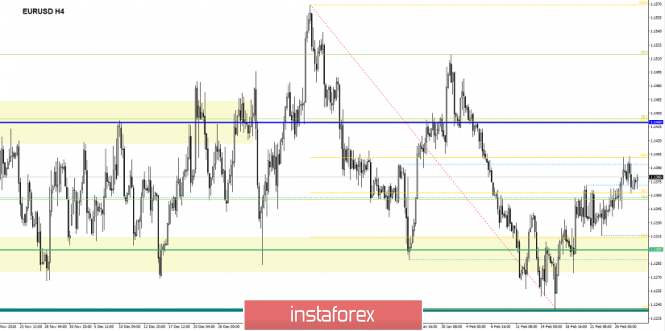
The currency pair Euro / Dollar for the last trading day showed low volatility with 41 points. However, you still have to pay tribute, the movement was focused on a logical pullback. From the point of view of technical analysis, we see that the previously predicted level of 1.1400 perfectly plays the role of temporary resistance; and a correction towards the recently passed cluster of 1.1370 (1.1320 / 1.1370) began to form in relation to it. The news background continues to focus on Brexit. This time, we have the statement of the British Parliament, which supported the proposal of Prime Minister Theresa May on the need to postpone the withdrawal of the country from the European Union. At the same time, German Chancellor Angela Merkel and French President Emmanuel Macron agree to a postponement of Brexit. "If the UK needs more time, we will not deny her that," - Merkel said. Naturally, this kind of background continued to stimulate the British currency, but the euro did not feel the problem on itself.

Today, in terms of the economic calendar , we have preliminary data on US GDP for the 4th quarter, where everything is not so good, a decline from 3.4% to 2.6%.
16:30 Moscow time - GDP (q / q) ( 4 q.)
Further development
Analyzing the current trading chart, we see that the pullback led us to the previously passed cluster of 1.1320 / 1.1370, and the upper limit plays a temporary pivot point. It is likely to assume that due to negative statistics on the United States, we can return to the value of 1.1400, but then we need to look further. While there is a hypothesis of bumpy 1.1370 / 1.1400, then we will have to analyze its borders for a breakdown.

Based on the available data, it is possible to decompose a number of variations, let's consider them:
- We consider to buy positions in case of price fixing above 1.1400 with the prospect of a move towards 1.1440. A more risky approach is considered in terms of short-term progress to 1.1400, based from current values.
We consider selling positions in the case of price fixing below 1.1370 with the prospect of a move to 1.1320.
Indicator Analysis
Analyzing a different sector of timeframes (TF ), we see that in the short, intraday and medium term, there is still an upward interest on the general background of the market. Indicators on smaller TFs changed to ascending order after the support reached near 1.1370.
Weekly volatility / Measurement of volatility: Month; Quarter; Year
Measurement of volatility reflects the average daily fluctuation , with the calculation for the Month / Quarter / Year.
(February 28, was based on the time of publication of the article)
The current time volatility is 17 points. In the case of turmoil within the boundaries of 1.1370 / 1.1400, the volatility will remain low. However, in case of a breakdown, we are expecting that things will become more interesting.
Key levels
Zones of resistance: 1.1440; 1.1550; 1.1650 *; 1.1720 **; 1.1850 **; 1.2100
Support areas: 1.1340 *; 1,1300 **; 1.1214 **; 1.1120; 1.1000
* Periodic level
** Range Level
The material has been provided by InstaForex Company - www.instaforex.com


 Download NOW!
No comments:
Post a Comment