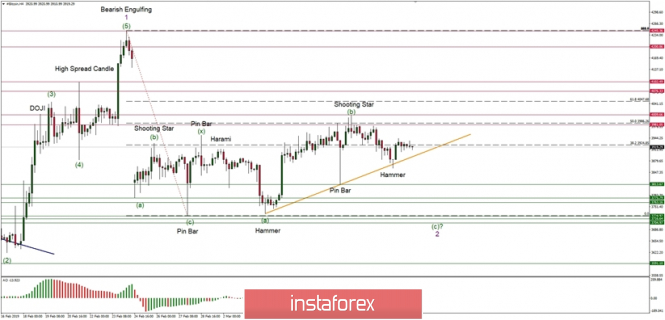
The horizontal correction continues.
Technical Market Overview:
At the BTC/USD market, another leg down was made towards the level of $3,813, but the price has bounced from the trendline support around the level of $3,859 after the Hammer candlestick pattern was made. Nevertheless, the bounce is shallow and the market should resume its down move soon. The next target for this wave is seen at the level of $3,813, but this is not the final target as the wave (c) should easily move below the bottom of the wave (a) located at the level of $3,724. The bearish bias continues and the momentum supports the negative outlook.
Weekly Pivot Points:
WR3 - $4,374
WR2 - $4,179
WR1 - $4,091
Weekly Pivot - $3,907
WS1 - $3,816
WS2 - $3,625
WS3 - $3,539
Trading Recommendations:
The battle of 50% Fibo retracement located at the level of $3,986 has been lost by bulls, so now only sell orders should be open as close as possible to this level. The protective stop-loss orders should be placed at $4,010 level as any violation of this level will invalidate the short-term bearish outlook. The potential wave (c) should be a form of an impulsive wave, so it will be a sudden and quick wave down (it even might be a spike down), so please be prepared.


 Download NOW!
No comments:
Post a Comment