
Technical market overview:
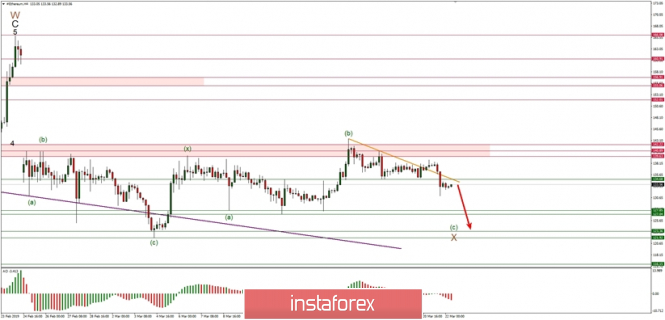
The trendline breakout at the ETH/USD market turned out to be a false breakout with a high at the level of 138.92 and since then the market got back under the trendline and break through the technical support at the level of 134.68. The new local low was made at the level of 131.02 and currently, the price is trying to test the level of 134.68 from below. Nevertheless, the target for the unfolding wave (c) is still seen at the level of 123.36.
Weekly Pivot Points:
WR3 - 162.50
WR2 - 153.11
WR1 - 146.18
Weekly Pivot - 134.66
WS1 - 129.36
WS2 - 120.05
WS3 - 112.99
Trading recommendations:
The first a target at the level of 134.68 has been hit, so now is time for the level of 127.85 to be tested as well. However, the final take profit level is still seen at 123.36 or slightly below, so it might be worth to wait for this level to be hit later.


 Download NOW!
No comments:
Post a Comment