
Technical market overview:
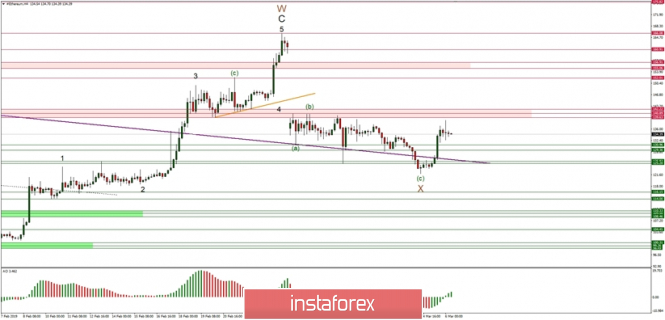
The ETH/USD pair has bounced from the level of 121.70 after a Hammer candlestick was made and rallied towards the technical resistance zone located between the levels of 139.63 - 141.22. The bulls were too weak to break through this zone and a Pin bar candle was made with a top at the level of 132.49. The low at the level of 121.70 might be considered a bottom for the wave (c) of the wave X, but has not been confirmed yet and the bias is still to the downside.
Weekly Pivot Points:
WR3 - 152.52
WR2 - 146.84
WR1 - 137.53
Weekly Pivot - 130.71
WS1 - 121.63
WS2 - 115.38
WS3 - 106.41
Trading Recommendations:
All sell orders from the last week should be still kept open with a target set at the level of 116.15. The protective stop loss orders should be moved to the level of 140.90. Any violation of this level will invalidate the downward cycle scenario.


 Download NOW!
No comments:
Post a Comment