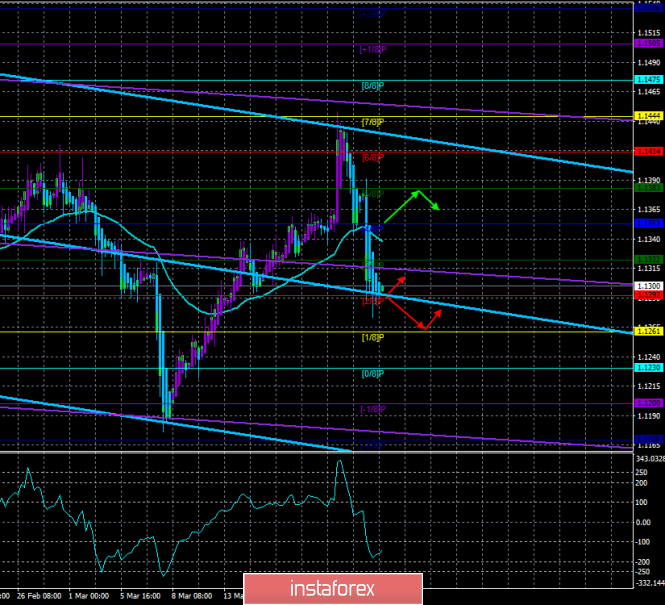
Technical details:
Senior linear regression channel: direction - down.
Junior linear regression channel: direction - down.
Moving average (20; smoothed) - down.
CCI: -135.0896
On Monday , March 25, the EUR / USD currency pair maintains the prospects for a downward movement even after the pair's two-day collapse. Despite the fact that Eurocurrency frankly collapsed in recent days, although there were no valid fundamental reasons for this, the market's main attention is still focused on the UK and the Brexit process. We will not touch on this topic right now and will try to determine what awaits the EUR / USD pair in the near future. Today, no important macroeconomic publications in the European Union and the United States will be published. A strong collapse of the euro in recent days means at least a change in for a downward trend and the need for a technical upward correction. Eurocurrency may again go down to the minima in the region of 1,1200 - 1,1300. The turning points up in this area were already as many as 7. Thus, in general, If you look at the higher timeframe, we are witnessing a long-term flat. Now, when the Fed, in fact, refused to continue the gradual tightening of monetary policy, the US dollar is losing one of its main trump cards in its opposition to the euro currency. Thus, we believe that in the coming weeks, the European currency has more chances for growth. However, technically, the instrument now needs to return to the area above the moving average line.
Nearest support levels:
S1 - 1,1292
S2 - 1.1261
S3 - 1.1230
Nearest resistance levels:
R1 - 1.1322
R2 - 1.1353
R3 - 1.1383
Trading recommendations:
Currency pair EUR / USD continues to move down. Thus, it is now recommended to consider sell orders with targets at 1.1292 and 1.1261. A reversal of the Heiken Ashi indicator up will signal the beginning of an upward correction.
Buy-positions will become relevant not earlier than fixing the pair back above the moving average line with targets at 1.1383 and 1.1414, as the trend for the pair in this case will change to ascending.
In addition to the technical picture, the fundamental data and the time of their release should also be taken into account.
Explanations for illustrations:
The senior linear regression channel contains the blue lines of unidirectional movement.
The younger linear regression channel contains the purple lines of unidirectional movement.
CCI - blue line in the indicator window.
The moving average (20; smoothed) is the blue line on the price chart.
Murray levels - multi-colored horizontal stripes .
Heiken Ashi is an indicator that are colored bars in blue or purple.
The material has been provided by InstaForex Company - www.instaforex.com


 Download NOW!
No comments:
Post a Comment