
Gold price remains in a short-term bullish trend as long as it holds above $1,300. Gold price continues to make higher highs and higher lows and is now challenging the 61.8% Fibonacci retracement resistance at $1,322. Breaking it will open the way for $1,330-33 major resistance.
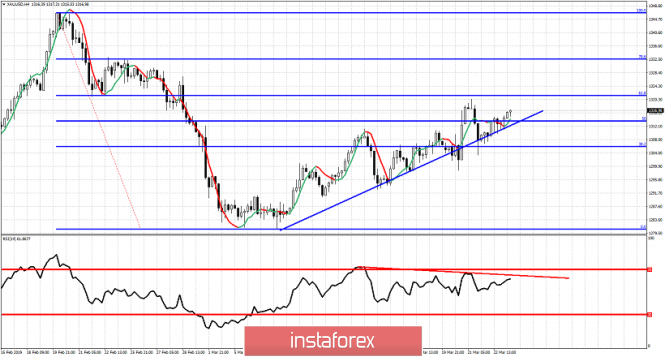
Blue line - trend line support
Red line - bearish divergence
So far we have one bearish divergence in the RSI and soon we could see another one. The blue trend line support is being respected so far and that is why short-term trend remains bullish. Support is at $1,310-$1,300 area. Breaking below $1,310 would be a bearish sign. A daily close below $1,300 will confirm a top is in. Resistance is at recent highs at $1,320.50 and breaking above it could push price above $1,322 towards $1,330 the next Fibonacci resistance level. At current levels with the RSI diverging, I prefer to be neutral or hold longs with stops at $1,310.
The material has been provided by InstaForex Company - www.instaforex.com


 Download NOW!
No comments:
Post a Comment